FA Application Package Tool Wear Diagnosis for Machine Tools

Wide-array of Analysis Technology Leveraging Data to Achieve Reliable Tool Diagnosis.
Automatic extraction of the target machining selection from collected data
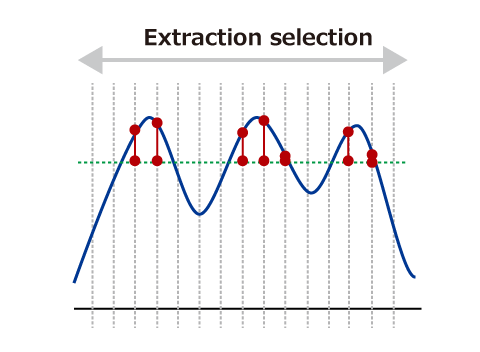
Analog data is collected at high speed during machining and only the data related to the machining load is automatically extracted. The feature value is then calculated from this extracted data.
The conditions for automatic extraction of the specified data can be set while checking the waveform using the Advanced Data Science Tool.
Continuous collection of machine tools data

Machining abnormalities can be instantly detected by comparing differences between various data!
Advanced Data Science Tool
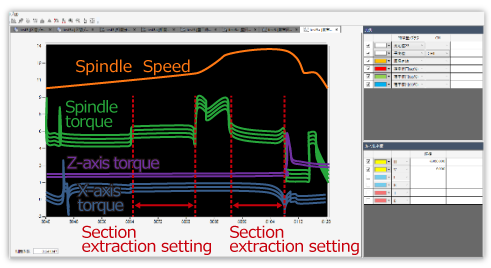
The extraction conditions for cutting out the section to be diagnosed are calculated from the cutting torque waveform change point, and the diagnostic features are calculated by the diagnostic system.
Selection of feature values with strong correlation according to the purpose of the diagnosis
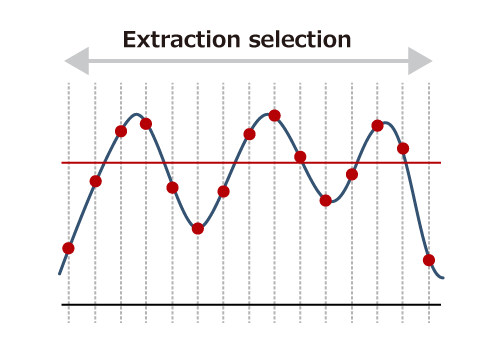
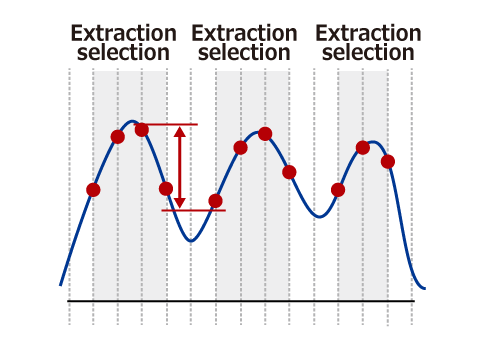
Depending on the particular purpose of the tool wear or machining abnormality diagnosis, it is possible to select appropriate feature values (average value, integral value, maximum value, minimum value, range value, median value, selection length, count of threshold passing, counts of exceeding thresholds, threshold exceeded time/average value/integral value).
If the machining conditions result in a very small load, any noise in the collected data may greatly affect the accuracy of the diagnosis. Therefore, primary processing techniques such as maintaining a moving average can be utilized to improve the S/N (signal/noise) ratio of the data to be diagnosed and the calculation accuracy of the feature value.
Average value
Range value
Integral value exceeding threshold
Optimization of Tool Change Timing
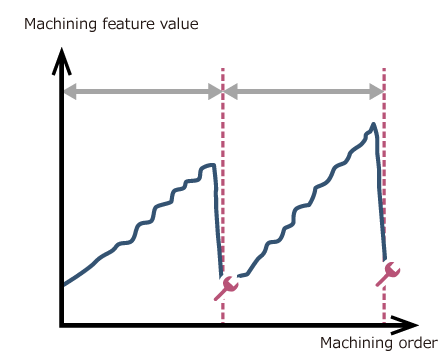
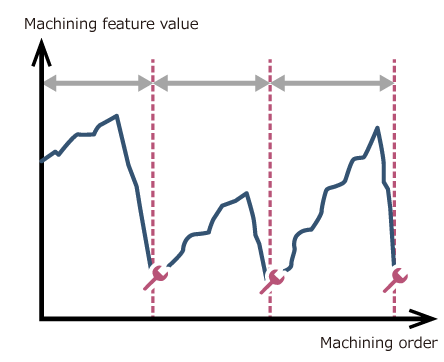
By making "models" from machining program number and tool number combinations, tool life can be diagnosed in relation to various machining conditions incorporated in the model, such as machined material, workpiece shape, spindle speed, cutting depth, and feed.
As such, even if one type of tool is used for production under various machining conditions, tool life for individual models can be stipulated, and tool diagnosis in multi-product variable-quantity production is possible by predicting deterioration to suit the progress of tool wear.
Slow tool wear
Wear differs depending on tool
Fast tool wear

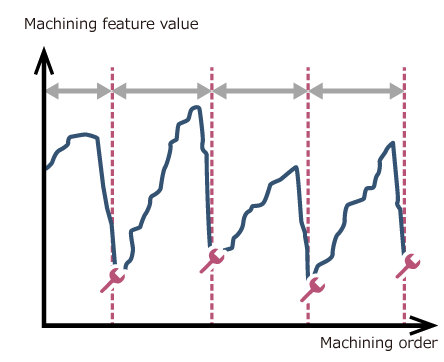
Diagnose optimal tool life to suit various tool wear!
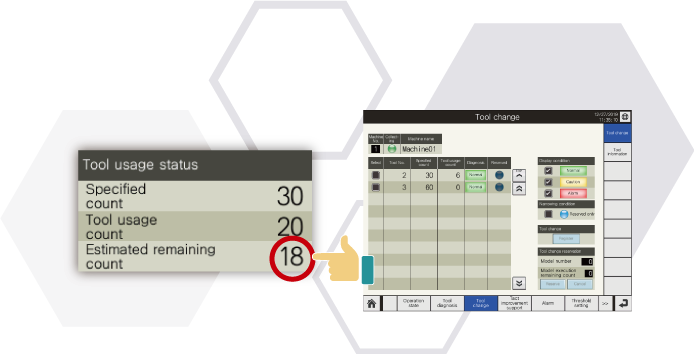
Tool service life can be determined from the number of times it can be used
Based on post-tool change differences in tool cutting performance and the status of varying-type/varying-volume production, displays predicted remaining count as available usage count to show how many more times a tool can perform machining until it reaches its life.
According to the estimated remaining count, the system can first provide the operator with a caution, and then a warning to aid operation.
If an abnormality occurs, an abnormality output can be sent externally also, enabling abnormality display on the machine tools, etc.*1
*1: If external abnormality input terminal has been prepared on the machine tools
Diagnosis for complicated machining geometries such as curved surfaces
When machining parts that interact with fluids or have an intricate design, it is often necessary to perform simultaneous control of multiple axes such as when performing precision finishing of curved surfaces.
In such cases, torque is applied not only to the spindle but also to various feed axes for cutting machining.
For these case, it is not possible to perform wear diagnosis by only looking at trends on a single axis.
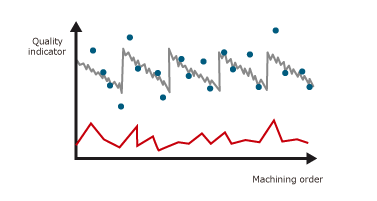
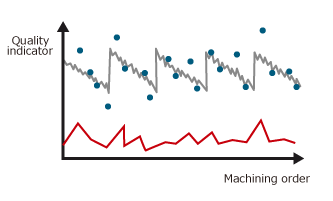
To solve this problem, we apply machine learning to the general relationship between trends of the feature values for each axis and the trends of measured values (quality indicators) and create a measured value predictive model.
By appropriately managing trends immediately after machining, it is possible to perform wear diagnosis even in the case of complicated geometries such as curved surfaces.

Creating an environment for easy AI (machine learning) utilization!
Basic knowledge of concepts in data science such as overtraining and multicollinearity problems is generally required for machine learning. However, in order to prevent these problems from occurring, this package automatically displays recommended machine learning feature values after it determines the data (quality indicators: measured values, inspection values) to be applied to learning. Furthermore, the learning target data can be divided into multiple blocks, and the system can then automatically verify which block contains a trained predictive model with high accuracy.
Example of learning data grouping using cross-validation

Example of inaccurate prediction model
Example of accurate prediction model (accuracy 5)
