FA Application Package Tool Wear Diagnosis for Machine Tools

The Advanced Data Science Tool is a software that links to iQ Monozukuri Tool Wear Diagnosis for Machine Tools to utilize IoT data for the support of tool diagnosis, equipment maintenance, and statistical analysis.


I want to check for any changes to the system state when a machining abnormality occurs!


 By comparing the waveforms of air-cut data and actual machining data, it is possible to determine differences in cutting load. This information can then be used to diagnose tool abnormalities.
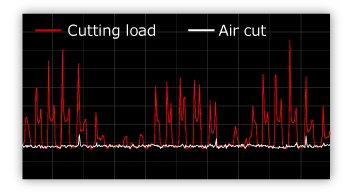
Understand the difference in waveforms between an air-cut and actual machining
 Comparing the waveforms allows you to better understand the difference between worn and new tools, as well as normal and abnormal machining.
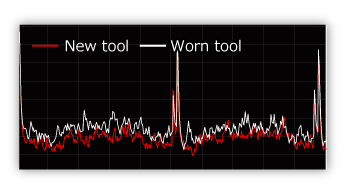
Understand the difference in waveforms between worn and new tools
 It is possible to check any tool deterioration trends and confirm any differences between molding (lots).
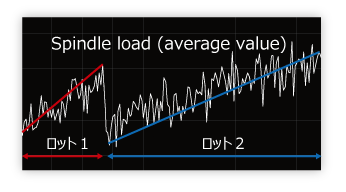
Comparison of deterioration trends due to differences between lots
it is possible to better understand various states during machining.
I want to utilize big data to detect machining and equipment abnormalities!


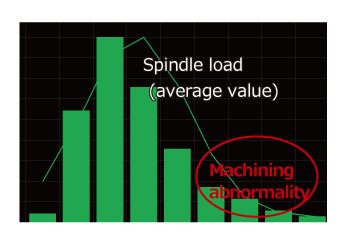
Check the variation in machining trends
 By plotting the same machining feature value on a histogram, it is possible to check for any variations in tool wear and better grasp any trends in machining abnormality data.
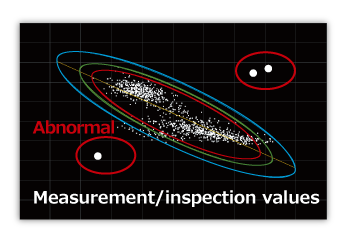
Check the correlation between measurement values, inspection values, and feature values
 It is possible to check the correlation between feature values and machining quality (measurement/inspection values) by plotting them on a scatter diagram. This can help you to detect any machining abnormalities by easily identifying outliers.
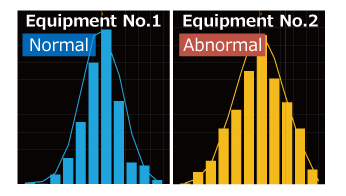
Check the variation of feature values between devices
 By comparing the feature value histograms of the same machining process between different equipment, it is possible to identify equipment differences and deterioration trends and easily detect equipment abnormalities.
I want to utilize IoT data to more accurately predict machining quality!


 Machine learning is applied to the relationship between IoT data and machining quality (measurement/inspection values) and a predictive model is automatically calculated.
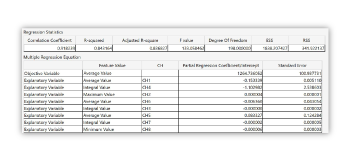
Automatic calculation of a predictive model
 Through cross-validation of learning and validation data that has been divided into blocks, it is possible to confirm the validity from the predictive model's regression analysis results. This improves overall calculation accuracy.
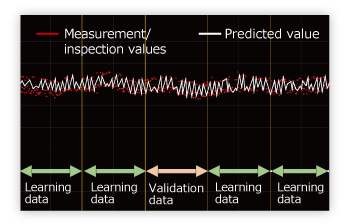
Cross-validation using learning data and validation data
 It is possible to check the prediction accuracy by comparing the calculated predicted values of the model with the actual measurement values.
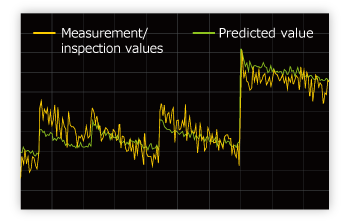
Confirmation of prediction accuracy
Main Functions
| Function type | Function details |
|---|---|
| Management of collected data | Display of a list of collected section data |
| Filtering the analysis target section data (by machining program or tool used) | |
| Deleting data that is not subject to analysis | |
| Temporary exclusion of data that is not subject to analysis | |
| Waveform display | Graphical display of machining waveform in chronological order |
| Parallel/normalized display of multiple channels | |
| Display of multiple section data superimposed | |
| Fixed display of section data | |
| Display of trends | Graphical display of selected feature values, measurement data, and prediction values |
| Parallel/normalized display of multiple feature values | |
| Display of tool change history | |
| Diagnosis threshold settings | Automatic threshold calculation for tool wear and machining abnormality diagnosis |
| File output of diagnostic threshold setting | |
| Statistical analysis | Display of a list of measurement data and feature value correlation coefficients |
| Scatter plot display of measurement data and selected feature values | |
| Grouping of interval data for learning/validation | |
| Automatic creation of predictive models by machine learning | |
| Cross-validation by group | |
| Graphical display of predicted measurement values (quality indicators) | |
| File output of predictive model setting | |
| Interval extraction settings | Machining waveform extraction (cleansing) condition settings |
| File output of interval extraction setting | |
| Data collection | Waveform/trend data collection and database construction |
Introduction Method

Purchase the FA Application Package

Entitlement ID application
Send "Product ID" provided with the product package to the contact point by e-mail.
Issue a Entitlement ID
Sent by e-mail within 24 hours from the contact point.
License key application preparation
Install FA Application Package, prepare a "License user application form".
License application file creation
Create a "License application file" with the installed application package.
License key application
Send "License user application form" and "License application file" to the contact point by e-mail.
Issue a License file
Sent by e-mail within 24 hours from the contact point.
License file registration
Register the "License file" with the installed application package.For the mail address of contact point, the contents to be sent, and the operation of the application package, refer to the application package manual.
Issued a "License file" is that can be used only on the personal computer used for the License key application.
(Note that it cannot be used with other personal computer.)