FA Application Package Tool Wear Diagnosis for Machine Tools

 Scene1
We change tools based on tool usage time/count, but I am unsure of the appropriate tool change timing in the case of varying-type/varying-volume production.

Reduction in Annual Tool Costs and Labor Required for Tool Change Work by Reducing the Frequency of Tool Change!
Predict optimal tool change timing even in the case of varying-type/varying-volume production!
Reduce tool change count as well as tool cost and labor!

Synchronously collect machining conditions and IoT data from machine tools
to capture wear trends and optimize tool operation!
Trends with regular tool change
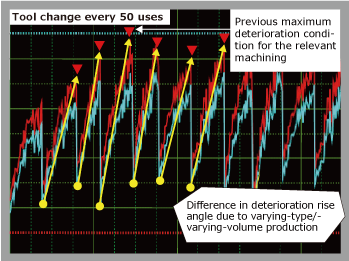
In the past, TBM*1 (tool usage count) was the basis for tool change, however it became apparent that tools were being changed prior to life expiration despite the potential to be used close to the maximum load for tool change results.
*1: TBM (Time Based Maintenance)
This refers to changing the tool periodically.
Trends when tools are replaced at usage limit (wear)
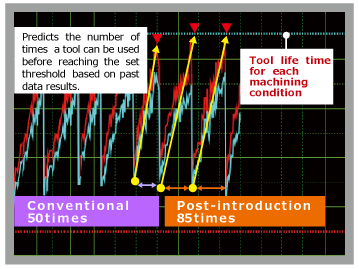
The optimal tool life in varying-type/varying-volume production was determined and tool maintenance was improved by switching from TBM (tool usage count) to condition-based maintenance CBM*2 (wear state). As a result in the reduction of tool replacement, saving tool costs by 40%.
*2: CBM (Condition Based Maintenance)
This refers to changing the tool immediately before the predicted usage limit based on tool wear status.
Annual tool cost by tool optimal tool change(example)
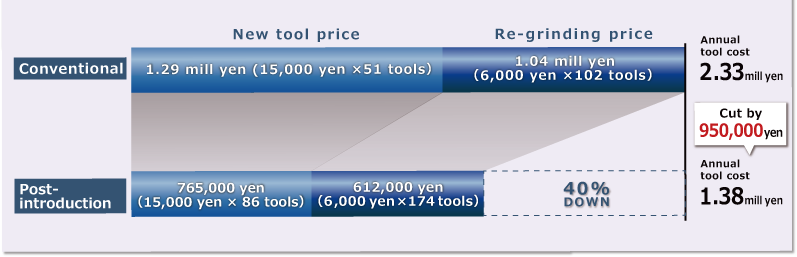
Customer usage conditions (example)
1 tool per machine tool
The tool is re-polished twice
(quality standards)
Number of production
13,000 / year
(50 / day × 260 days)
Number of tool changes
260 times/ year
(50 pieces processed)
Purchase number of new tools
260 times / 3 = 86
Re-polishing number
260 - 86 = 174
 Scene2
Quality defects occur due to sudden tool abnormalities or manufacturing abnormalities in the upstream process.
Reducing Loss Cost by Preventing Leakage of Products with Quality Defects Due to Machining Faults!
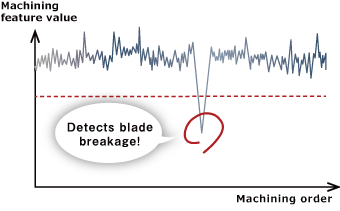
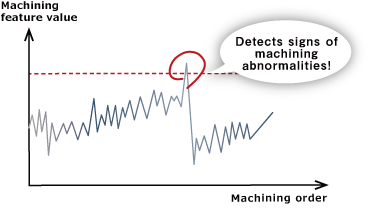
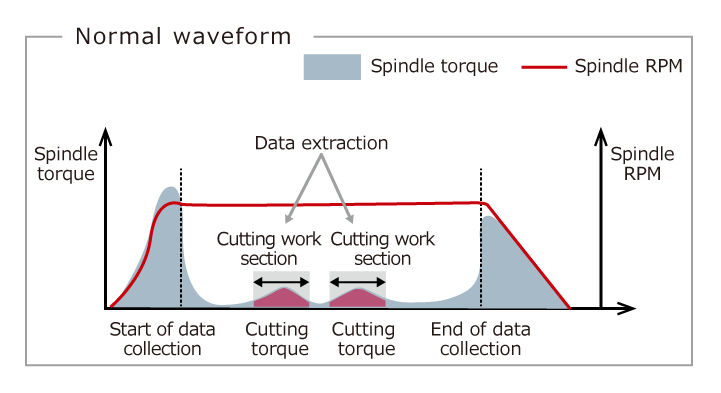
Immediately after machining, detects abnormalities by identifying things that "Differ to the norm!" based on change from machining feature value in normal times!
Capture changes with machining feature value during normal machining, to support extraction of diagnosis thresholds for judging abnormal machining!
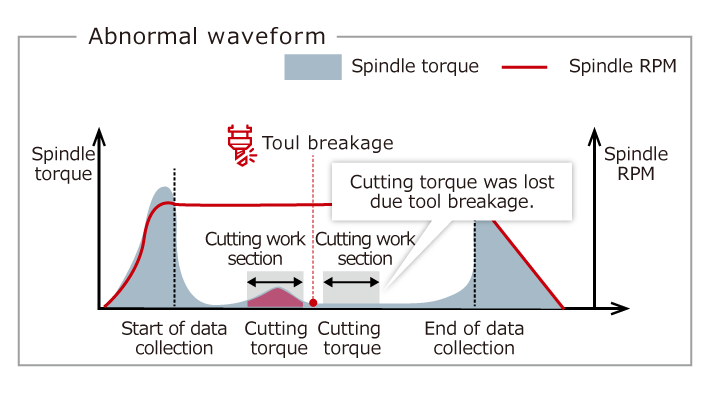
Detection of tool breakage
Detection of machining abnormalities due to mold deformation
 Scene3
I want to eliminate tool breakage detection time, which is a waste of operating time.
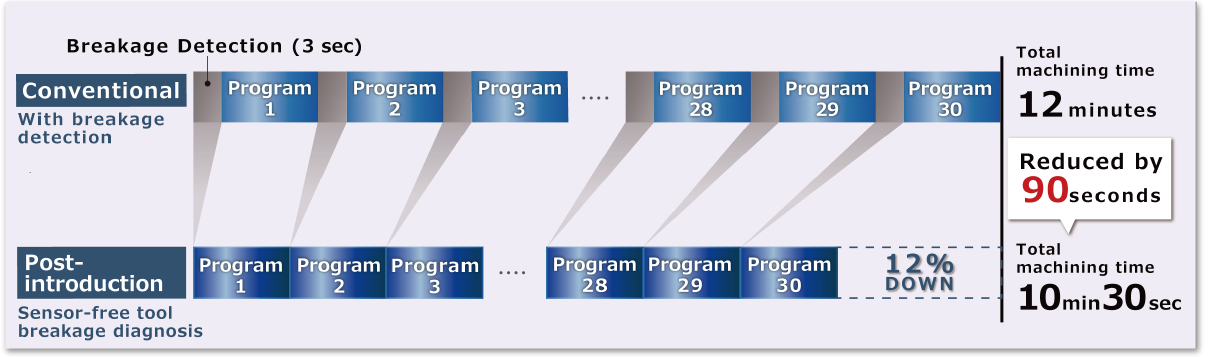
Productivity Increase by 10% or Higher Due to Shorter Breakage Detection Time!
By leveraging IoT machining data, cycle time was significantly improved!
Able to detect tool breakages using IoT machining data only, making sensor-less tool breakage possible!
Change of feature value trend at tool breakage
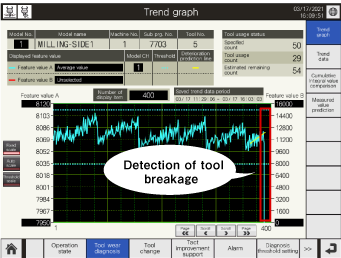
Detect tool breakage in real-time
Integral value Threshold
Alarm output at tool breakage
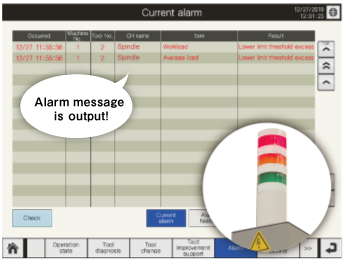
When a tool breakage is detected, an alarm message is outputted and the signal tower*1 illuminates!
*1: If external abnormality input terminal has been prepared on the machine tools.
By extracting section data from machining IoT data, slight changes in tool breakage can be detected, resulting in easier abnormality detection.
Cycle time improvement with tool diagnosis (example)
 Scene4
Even when a product does not meet the quality standard, the process that caused the abnormality is unclear.
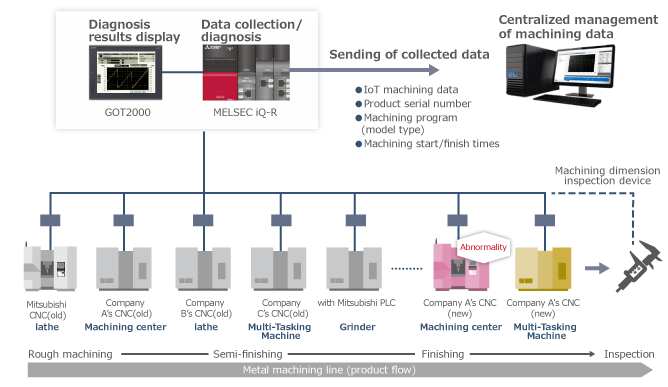
Centralized Management of Machining Data Contributing to Traceability
The collected data includes product types, processing conditions (machining program), product serial numbers, and tool numbers and secures traceability.
The reference of product serial numbers is also useful to connect inspection data.
 Scene5
A machining line may consist of a variety of new and old machine tools such as machining centers, lathes, Multi-Tasking Machine, and grinders, which makes data collection difficult.
Capable of Connection with Various Machine Tools - Both New and Old
By collecting machining data from up to 10 machine tools equipped with CNC of different manufacturers, uniform control of machining diagnosis and tool change operations becomes possible.
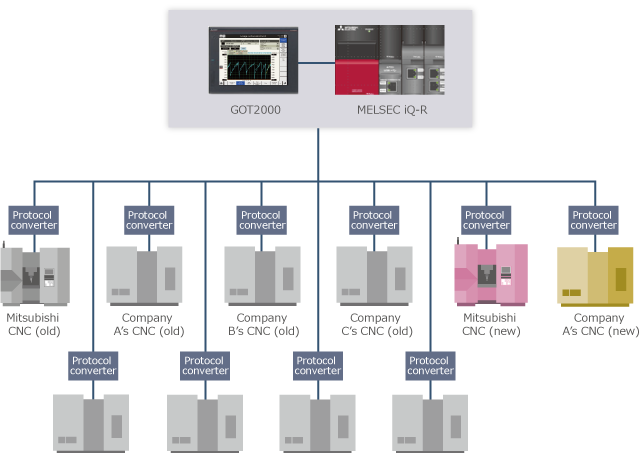
Please contact your local branch or dealer for details on connectable CNC models and machine tools without CNC.
 Scene6
Regular maintenance cannot prevent unplanned outage due to failure to detect signs of machine deterioration.
Support for predictive diagnosis through monitoring mechanical errors
Machine deterioration can be visualized by calculating the standard deviation of the varied machining loads from the spindle deflection for each fixed number of machining operations!
Spindle motor load (Overlapped machining waveforms by 300 data)
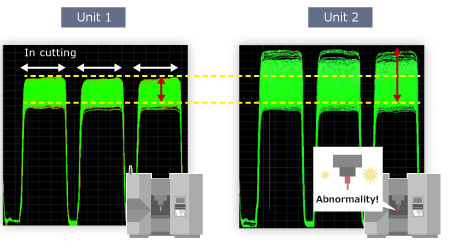
The two are the same model, but the results are different!
Wide...
Large load variation!
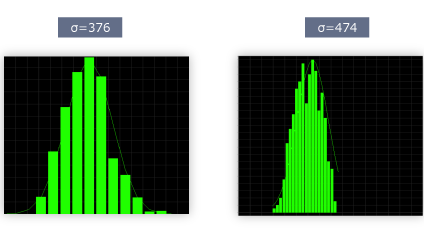
Histogram of the feature (standard deviation) is
Significantly Different!
It found that occurred shaft wobble by mechanical abrasion of the Unit 2 equipment spindle motor!
Overhaul of Unit 2 spindle!
Standard deviation by 300 machining processes
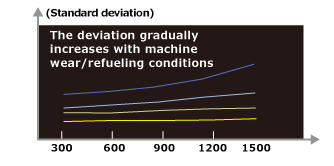
It is useful for appropriate preventive/predictive maintenance to check mechanical errors and aging deterioration trends with standard deviation values!
 Scene7
I want to prevent the outflow of machining defects.
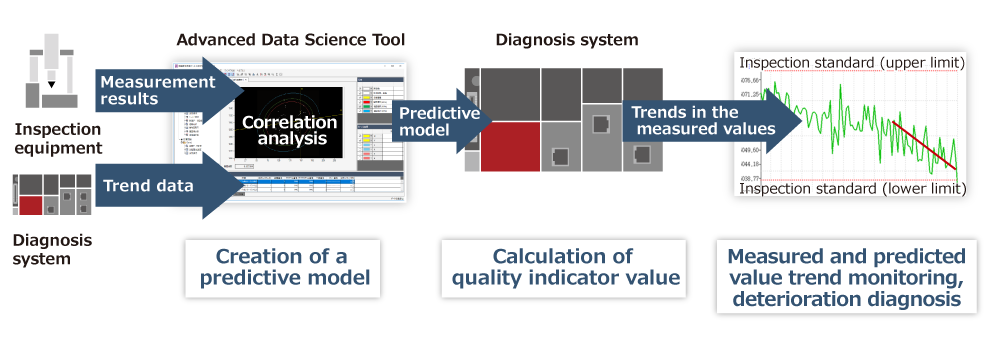
Predicting Geometrical Tolerances and Process Quality from IoT Data to Prevent the Outflow of Machining Defects
Machine learning is applied to the relationship between measurement results and IoT data to create a predictive model for the measurement results.
This predictive model is used to calculate the level of quality immediately after machining to prevent the outflow of defective parts to the subsequent process.
Features

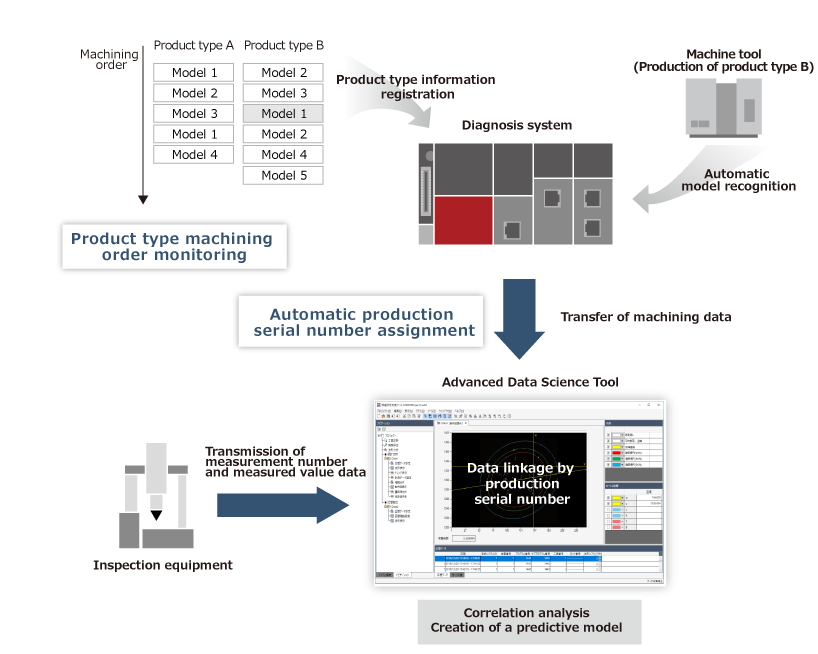
The Advanced Data Science Tool is used to analyze the correlation between IoT data (feature values) and measurement results. The results of this analysis are fed into a machine learning algorithm and feature values and measurement results that have a strong degree of correlation are used to create a predictive model.

This predictive model is incorporated into the diagnosis system to calculate the level of quality (measured value) after each machining process.

Trends in quality indicators are displayed on the GOT screen, which allows easy threshold monitoring and trend diagnosis. This makes it possible to predict the number of times the current tool can be used before you will see a deviation in quality indicators and allows you to detect sudden changes in quality.
 Scene8
When there is an inspection failure, I want to quickly check the IoT data of the failed part and investigate the cause.
Utilization of IoT Data to Accelerate Investigations Into the Causes of Sudden Inspection Failures!
The Advanced Data Science Tool enables you to manage and link the IoT data with measurement results. This makes it easier to search for data indicating a failure.
Features
Even when performing a series of machining process using several machining programs, the same production serial number*1 is automatically assigned to the entire series of IoT data.
With the Advanced Data Science Tool, it is possible to display a list of the IoT data with its assigned production serial numbers and the corresponding inspection data for the same product type in parallel, as well as to link the both data on the tool.
*1: The lot number or Two-dimensional code equivalent to the product serial number is scanned with a dedicated reader. When it is possible to notify the diagnosis system, this code can be assigned to the IoT data.