Controllers MELSEC iQ-R Series Product features -Solution-

Smart factory
IT system coordination utilizing advanced information modules
The MELSEC iQ-R Series advanced information modules enable smooth coordination between the IT system and the shop floor.
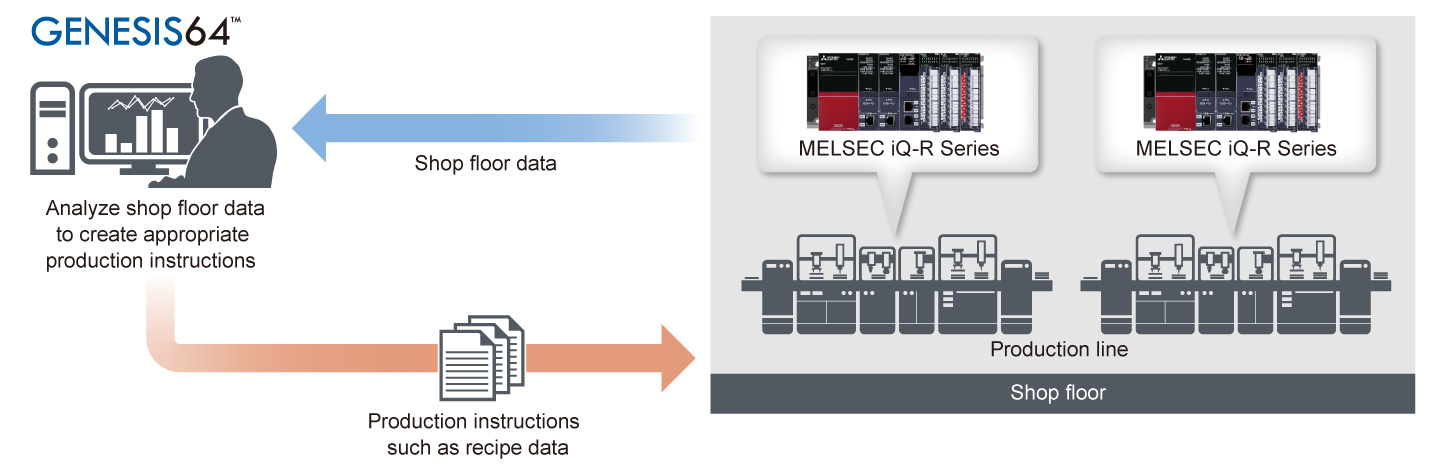
Point1Provide production instructions according to the situation in coordination with the SCADA system
- Utilizing the MES interface module or OPC UA server module enables handling of production data such as production instructions (e.g., recipe data) and production data (e.g., number of faulty products)
- Data collected from the shop floor is analyzed using SCADA software such as GENESIS64™, and production instructions based on that analysis can be provided to related systems
- Efficient production is possible with real-time data coordination of production instructions and production data
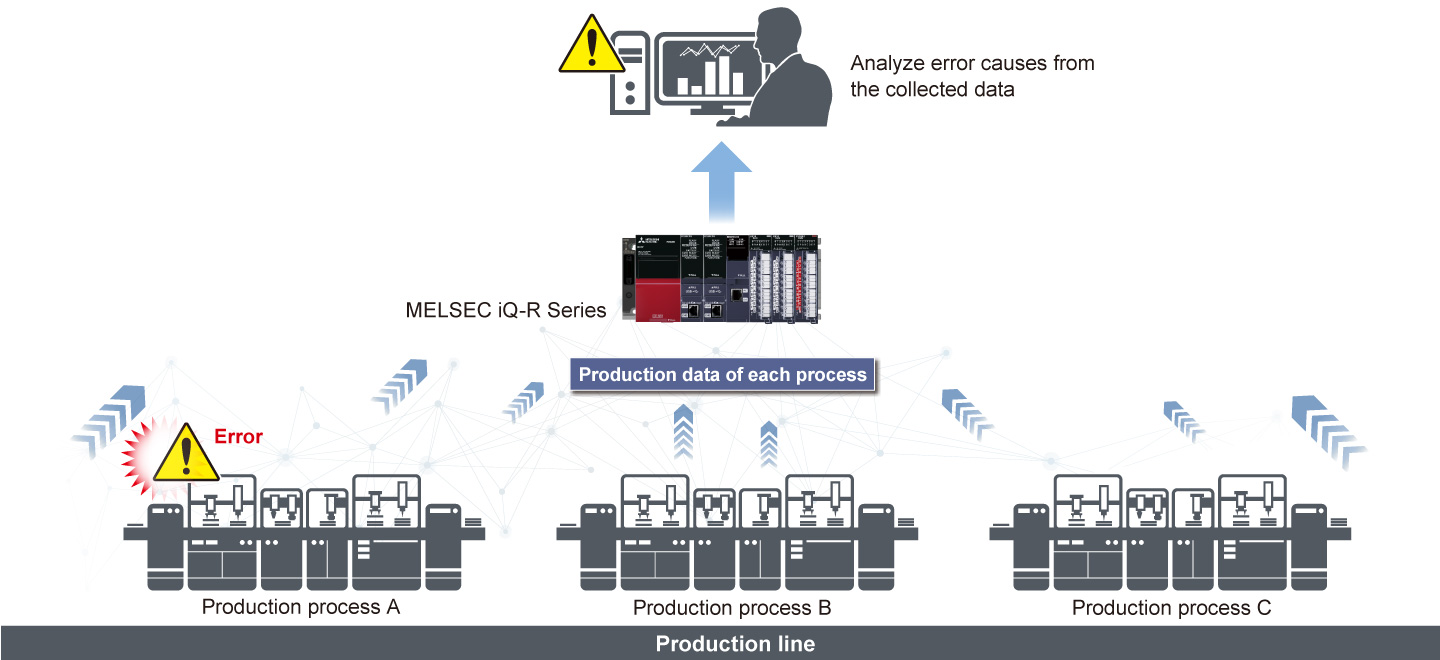
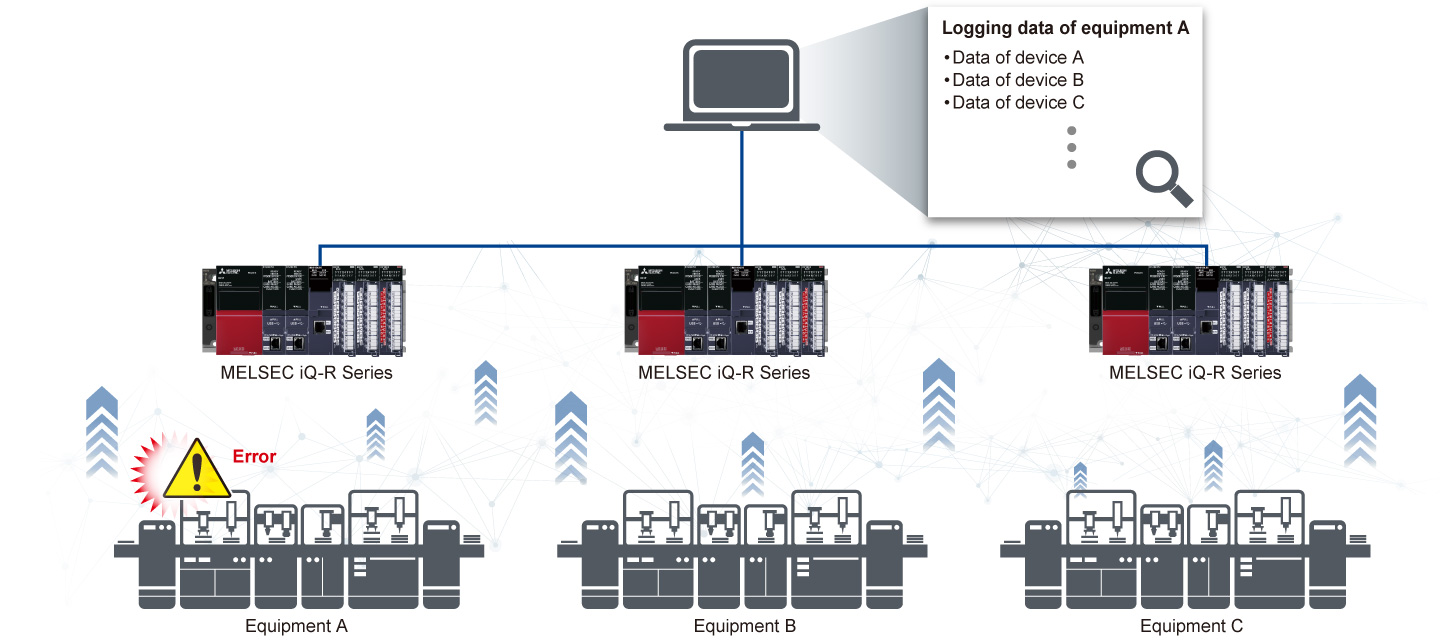
Point2Utilize production data collected at high speed for traceability
- Utilizing a high-speed data logger module, production data can be collected at 0.5 ms (max.) and easily checked as Excel®/CSV files
- Data for each process can be collected even if a problem occurs in any of the production processes, helping to identify an error cause in more detail
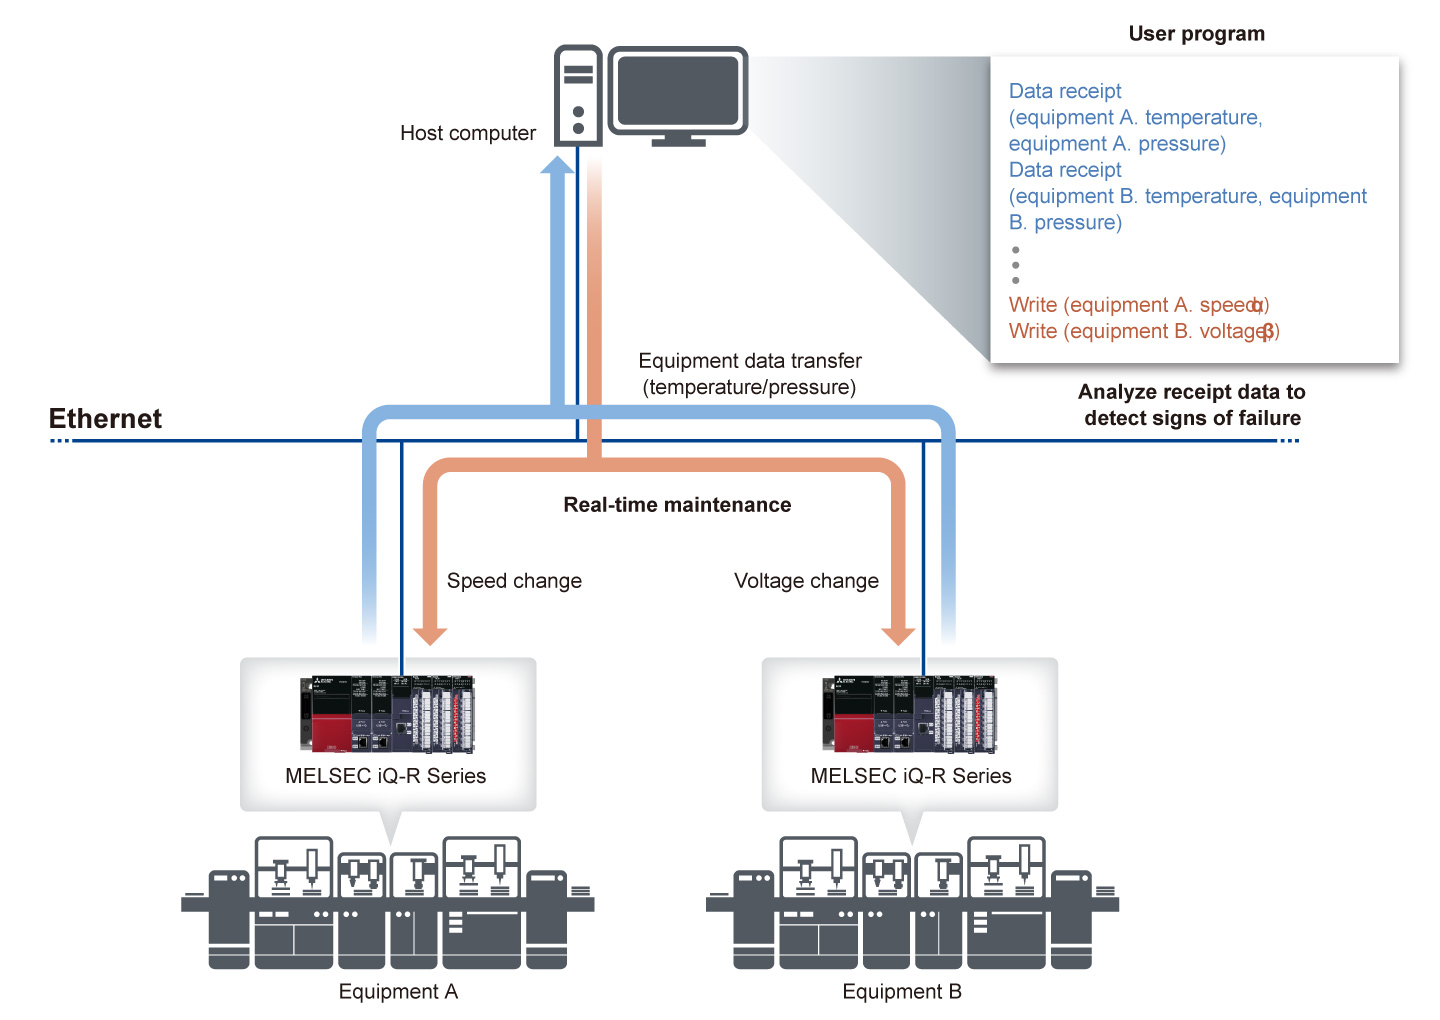
Point3Detect signs of failure in real-time from equipment operating data
- Utilizing the high-speed data communication module, signs of failure can be detected in real-time by receiving and analyzing equipment operating data
- Equipment can be maintained before it malfunctions, reducing system downtime and improving productivity
Simple IT coordination utilizing software
Utilizing data access software MX Component and MX Sheet can visualize the shop floor data.
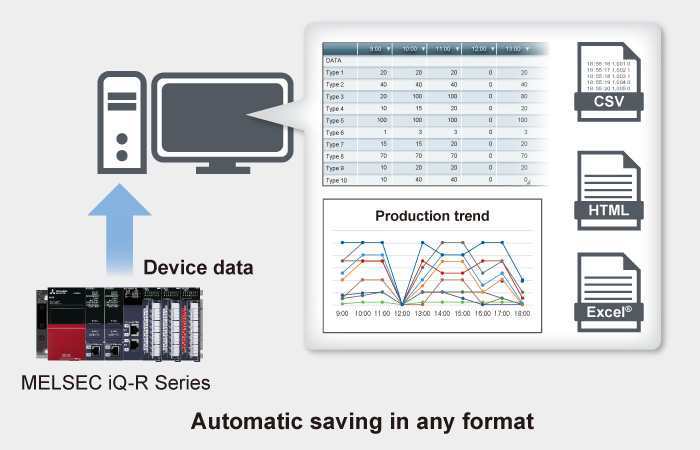
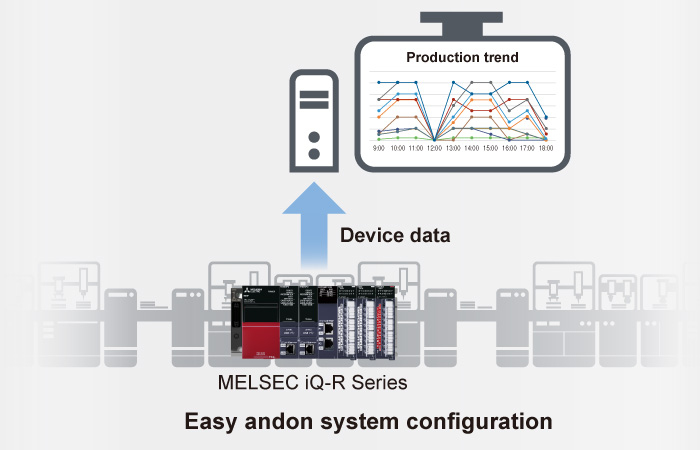
Point4Visualize programmable controller data to utilize for reporting
- Automatically collect programmable controller device data to generate spreadsheet reports, reducing time to check and transcribe data
- Collected device data can be processed by Excel®, allowing easy andon system configuration
Support IIoT on the shop floor with e-F@ctory starter package
The e-F@ctory starter package includes sample projects for the MELSEC iQ-R/iQ-F Series and the GOT2000 Series. Programs for visualization and simple analysis are provided in sample project format, supporting an IIoT infrastructure on the shop floor just with basic settings such as device assignment and parameter registration.
Point5Easily realize IIoT with extensive lineups for different purposes
- Various functions for equipment management, maintenance, and improvement are available
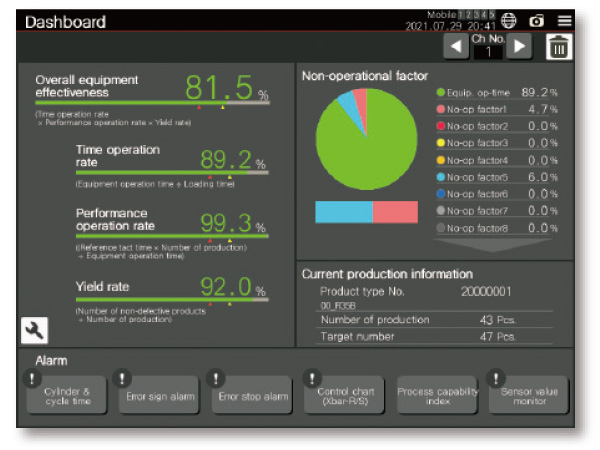
Visualize overall equipment effectiveness
MELSEC iQ-RMELSEC iQ-F
Comprehensively displays the production and operational status of the equipment such as equipment overall effectiveness and number of production.*1
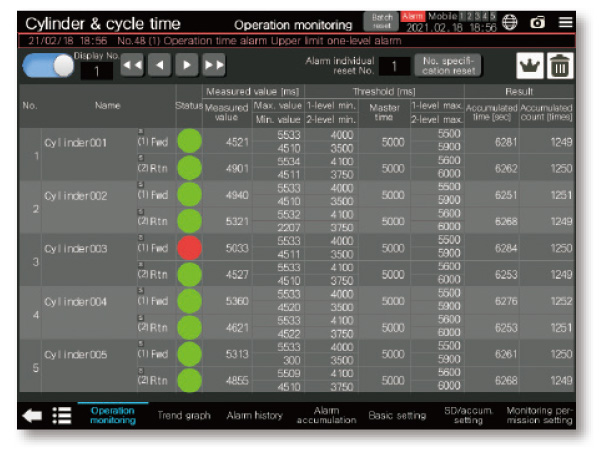
Error detection by measuring the cylinder operating cycle time
MELSEC iQ-RMELSEC iQ-F
Counts and monitors the cylinder operating status and the equipment operation cycle to monitor the error sign.*1
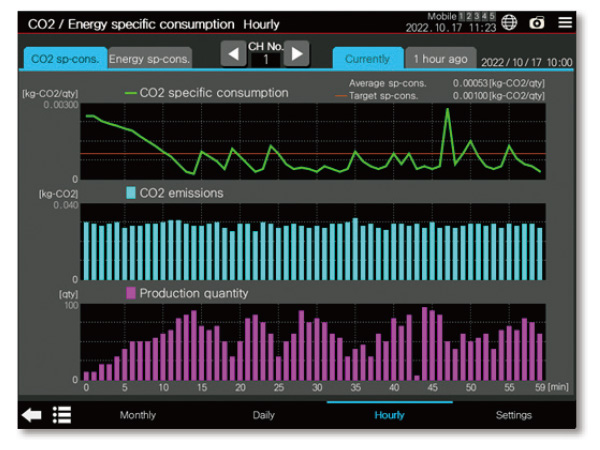
Easily acquire and visualize CO2 emissions and other data
MELSEC iQ-R
CO2 emissions, specific energy consumption, production volume, electric energy can be easily checked. Electric energy and production volume data are saved for energy loss analysis per production line and equipment process.
- *1.The screen is from the MELSEC iQ-R Series.
Achieve shop floor visualization effortlessly with DataNavigateApp
DataNavigateApp is a dedicated application for the C intelligent function module.
Its various features support shop floor visualization and analysis, which is the first step toward factory-wide visualization.
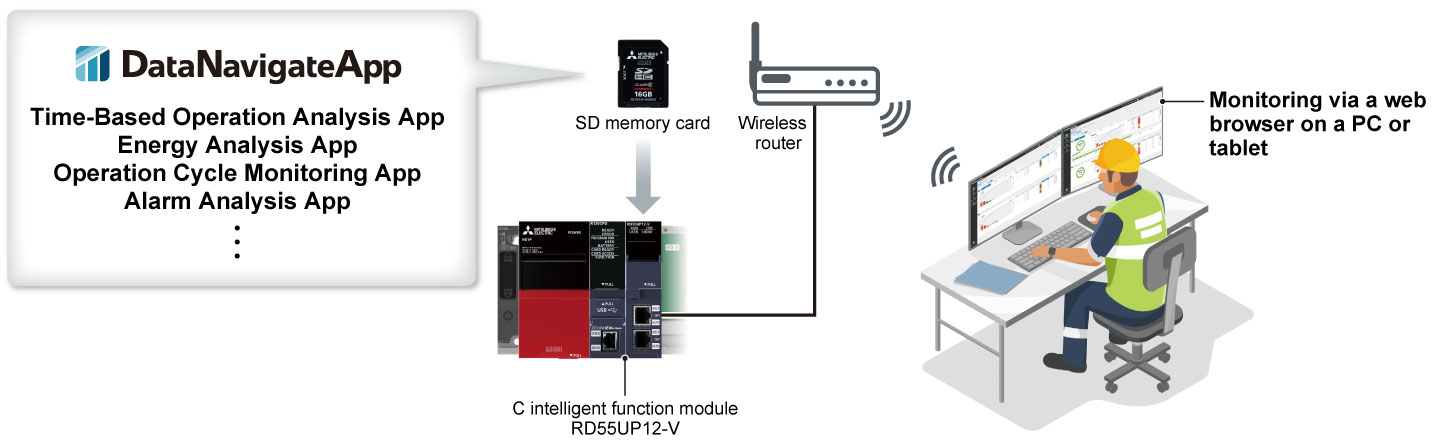
Point6Monitoring and setting via a web browser, enabling intuitive implementation and operation
- Perform initial setup and setting changes with intuitive operations. No specialized programming knowledge is required
- Monitor and configure settings using a web browser on a computer or other device. No dedicated equipment, such as an HMI, is necessary
Time-Based Operation Analysis App
Visualize equipment operational status
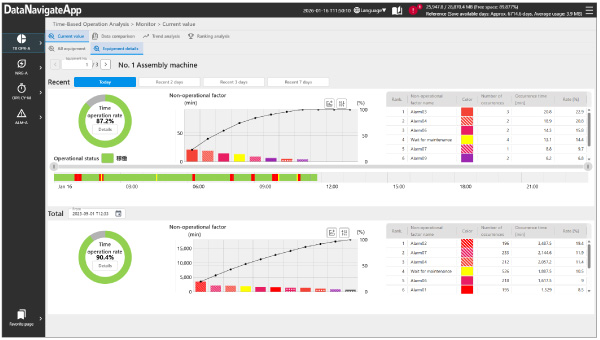
Analyze the causes of reduced time-based
operation rates
Energy Analysis App
Visualize equipment energy consumption
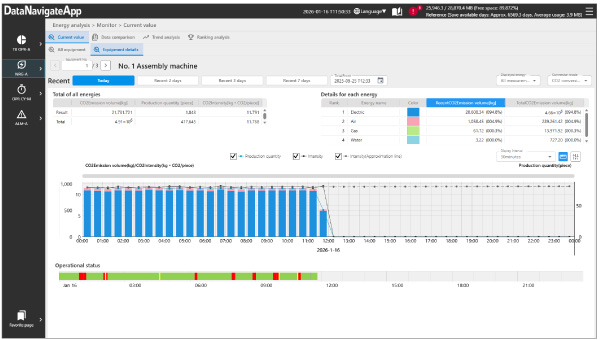
Find ways to improve energy efficiency
Operation Cycle Monitoring App
Monitor cylinder and equipment cycle time
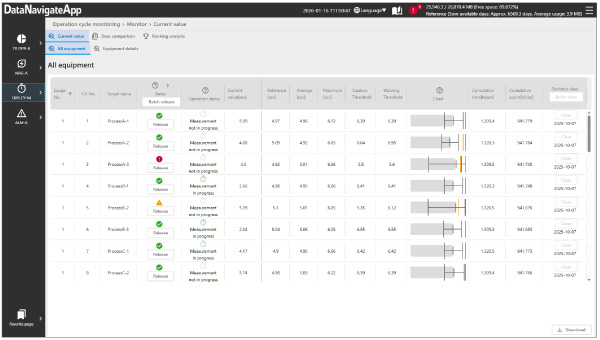
Detect abnormal signs and performance
degradation
Alarm Analysis App
Visualize alarm occurrence
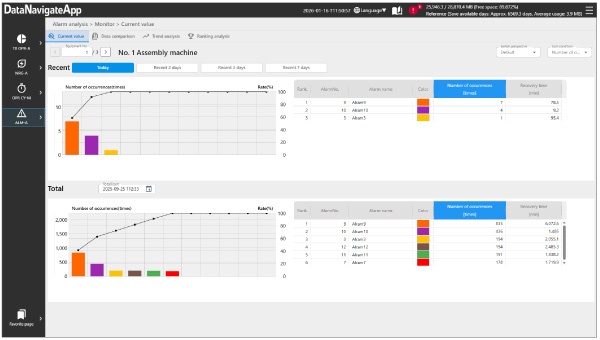
Identify frequently occurring abnormalities
and those with significant impact
Visualization solution of production and IT data
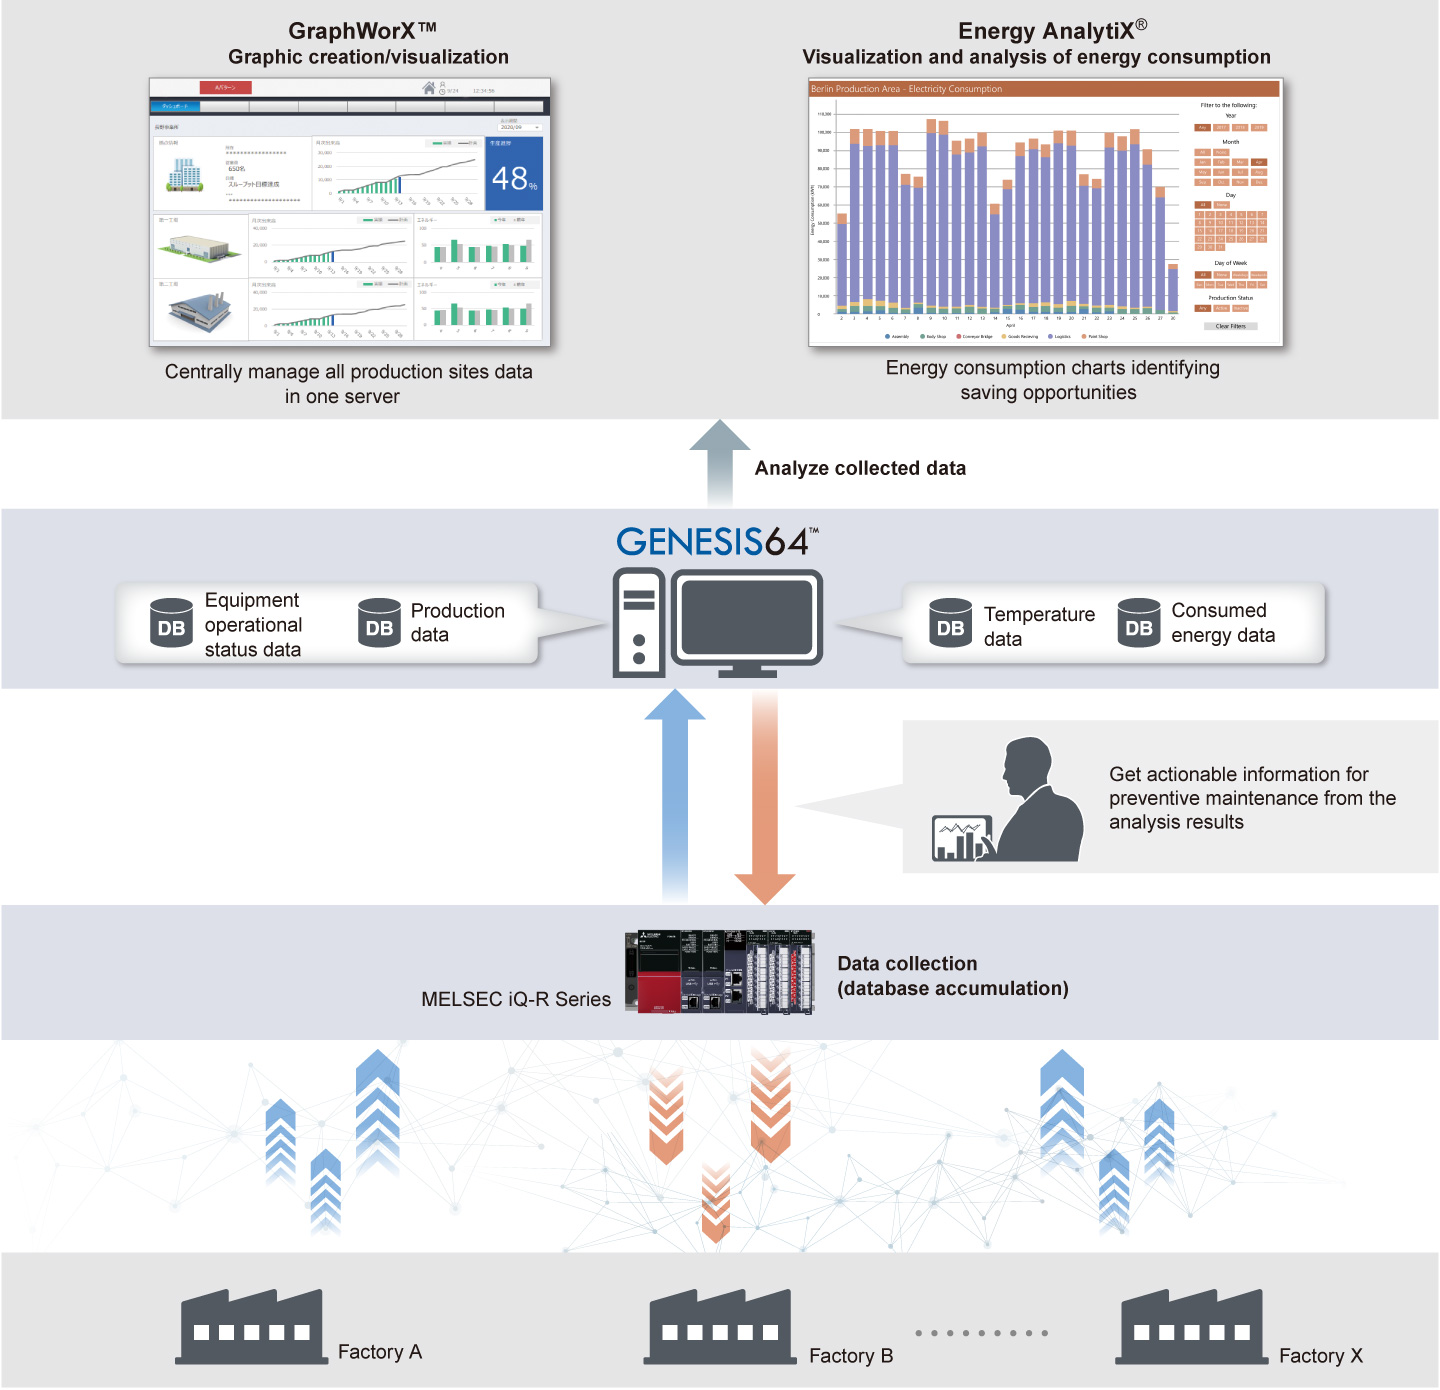
SCADA software GENESIS64™ is IIoT platform which enables unified management of production and IT data, enabling monitoring and analysis of various data. This cutting-edge software delivers real-time visualization, mobility, analytics, and connectivity to deliver a contextualized view of enterprise operations for manufacturing, industrial automation, and smart buildings customers.
Point7Visualizing data for preventive maintenance
- Utilizing GENESIS64™, multi-site production monitoring is possible, helping to reduce facility operating costs
- Real-time monitoring enables efficient operation of equipment, resulting in high productivity
- Analysis results of monitored data can be fed back to the production line for utilization for preventive maintenance
Smooth coordination with various devices
Smooth coordination with devices is possible with simple CPU communication function which enables data communication between programmable controllers and CC-Link IE TSN which enables seamless general, safety and drive communication between the IT systems and the shop floor.
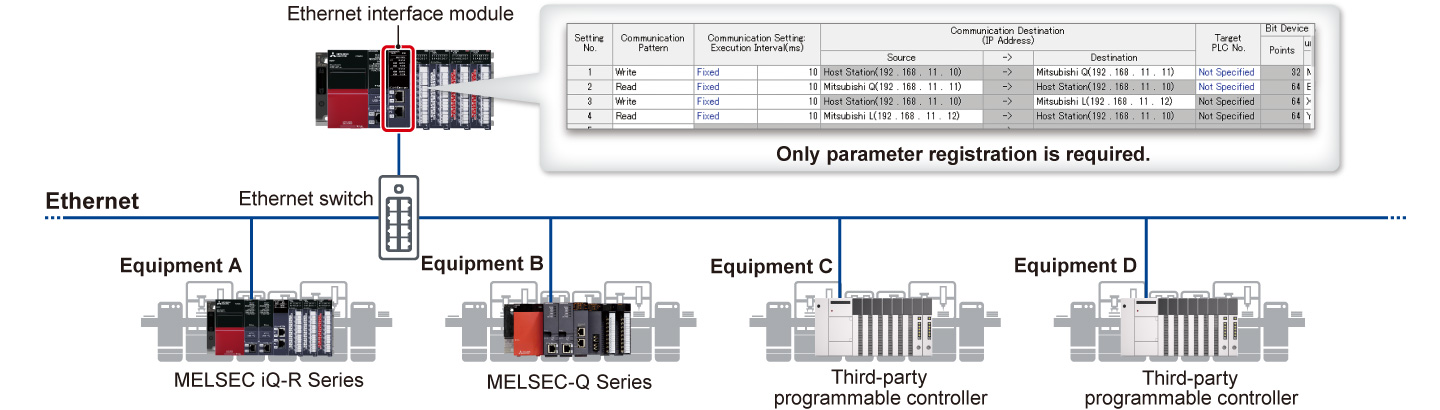
Point8Easy data coordination with third-party programmable controllers just by registering parameters
- With the Ethernet interface module, you can exchange device data not only with Mitsubishi Electric programmable controllers but also with existing third-party programmable controllers simply by registering parameters (simple CPU communication function)*2
- Data collection is easier without changing programs of the existing programmable controllers
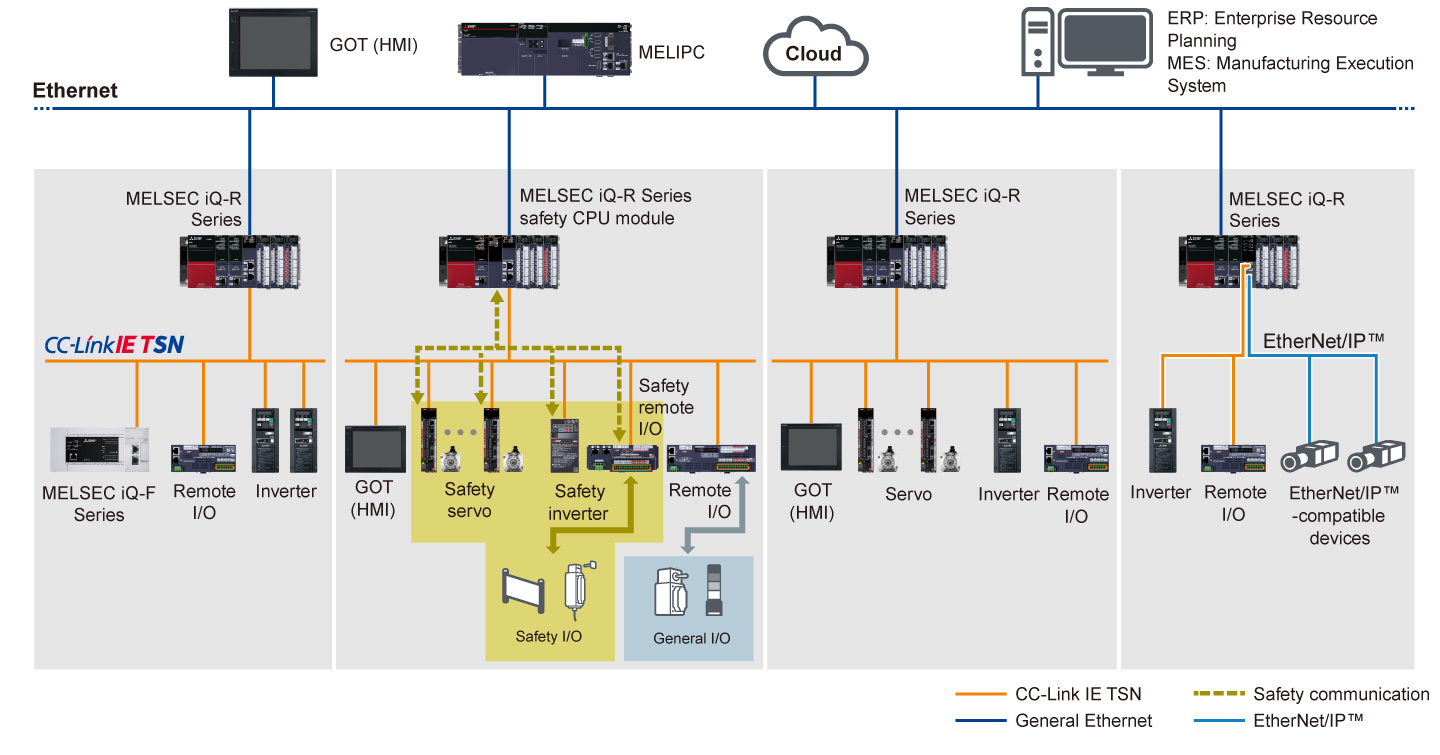
Point9CC-Link IE TSN seamlessly connects the IT system and the shop floor on one network
- CC-Link IE TSN can integrate general, safety, and drive communications into one network, enabling flexible system configuration
- Various data from different processes can be transferred to the main controller and IT system utilizing edge-computing devices such as MELIPC, realizing easy data coordination
- The CC-Link IE TSN Plus master/local module supports EtherNet/IP™ devices while maintaining the high-speed/high-accuracy communications of CC-Link IE TSN
Corrective maintenance solution with system recorder
Point10Extensive collection of error related data
- Prompt error cause identification is important to minimize the equipment downtime
- As all device and label data related to errors can be collected, there is no worry about selecting recording targets
Point11Recording-compatible devices*3 record the entire data synchronously, enabling easier error-cause identification
- When any of the compatible modules detects an error, all data recorded in the system is saved at the same time
- Even for the large-scale system, errors can be notified to other stations via CC-Link IE TSN
- By comparing the control data for each device and video feeds when an error occurs, the error cause within multiple devices can be easily analyzed
- *3.The recorder module, camera recorder module, motion CPU module, and motion module are supported.
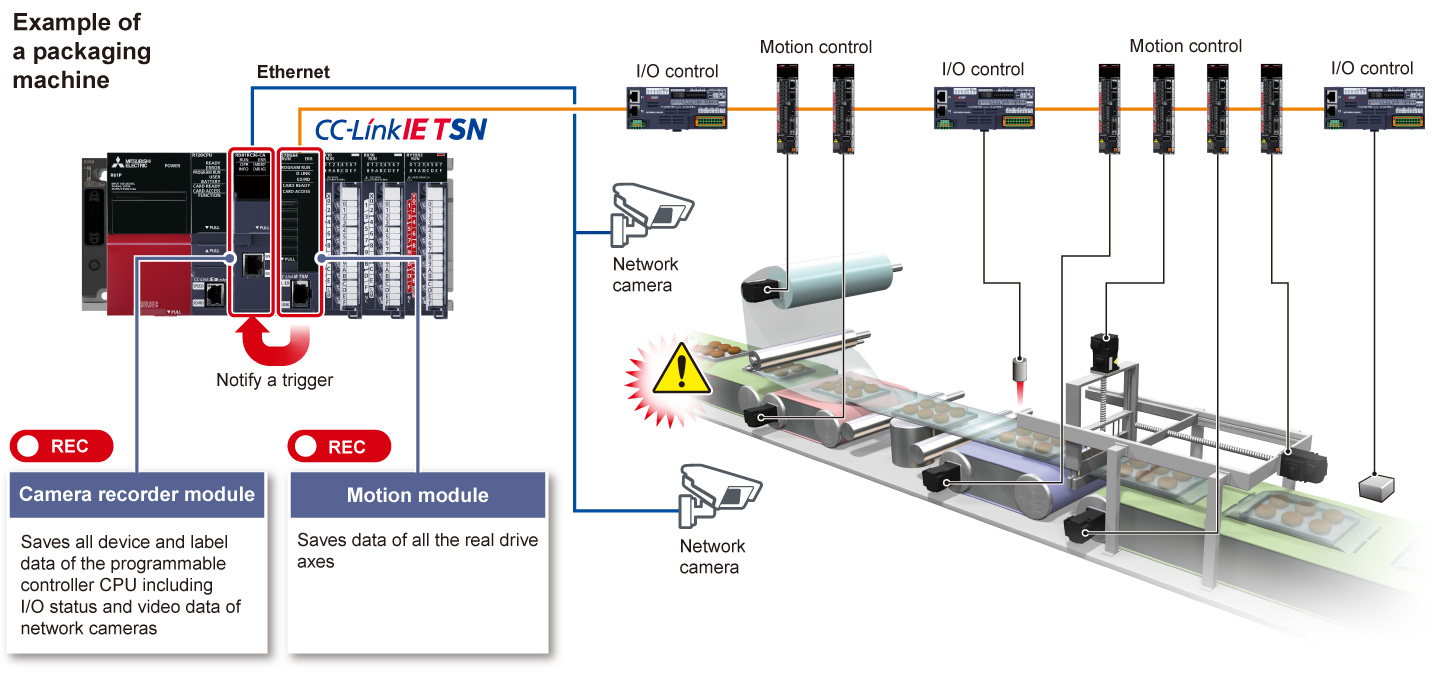
Point12Record the moment when an error occurs
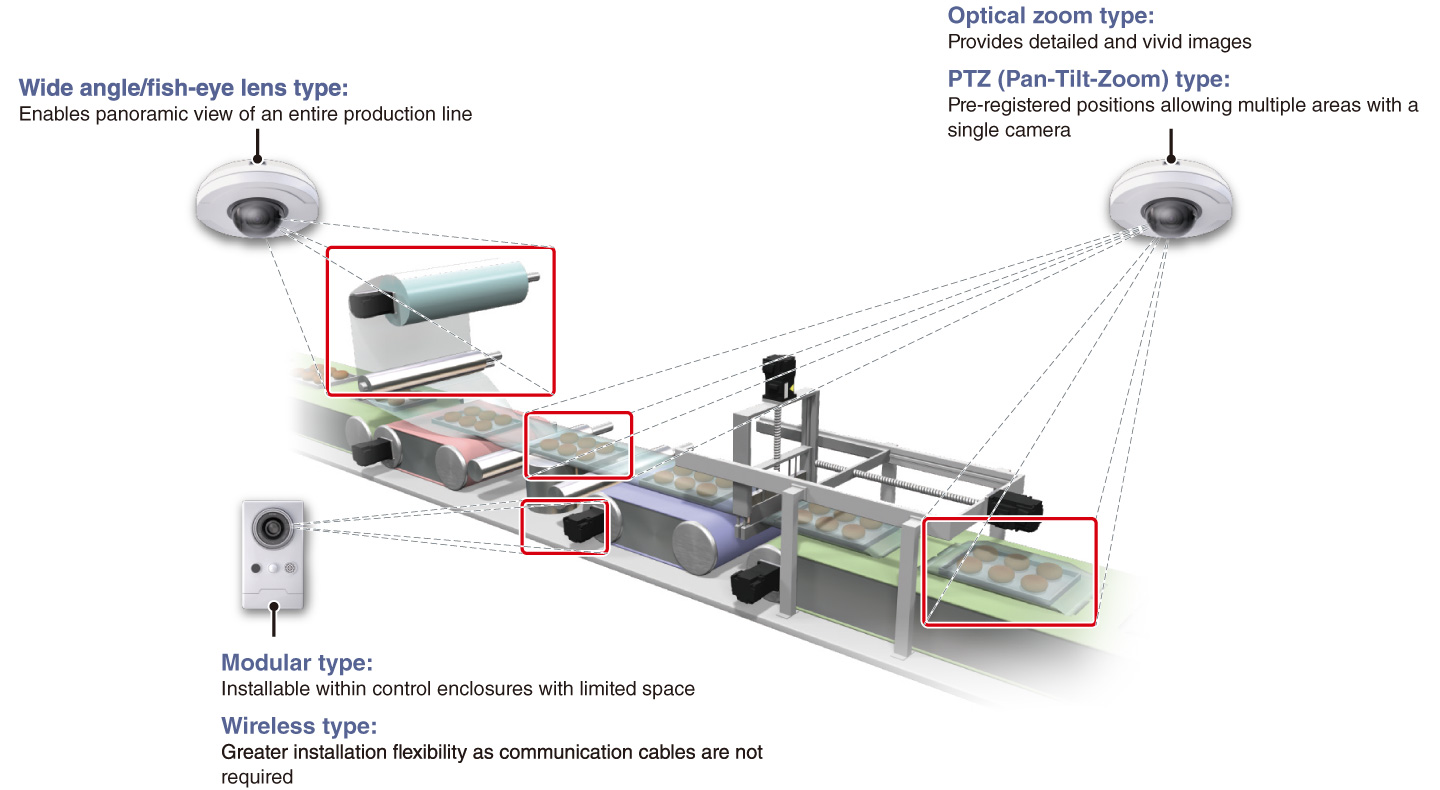
- Network camera image recording allows identification of the moment an error occurs
- By supporting available network cameras offers a broad choice of functions that maybe specific to an application and installation environment
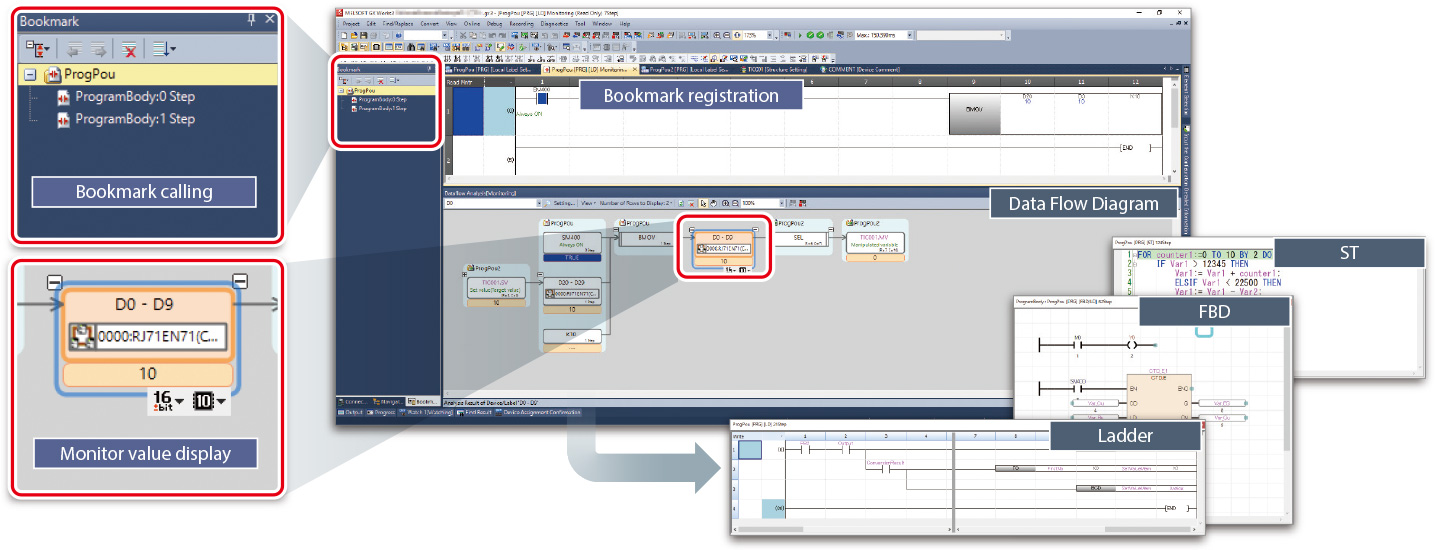
Point13Quickly identify an error cause
-
Device/label data related to an error and programs used can be checked on one screen
- ❶Device and labels together with the affected area can be visualized within the flowchart
- ❷Areas of concern in the program can be bookmarked for later check
- ❸Monitored values and programs can be checked easily
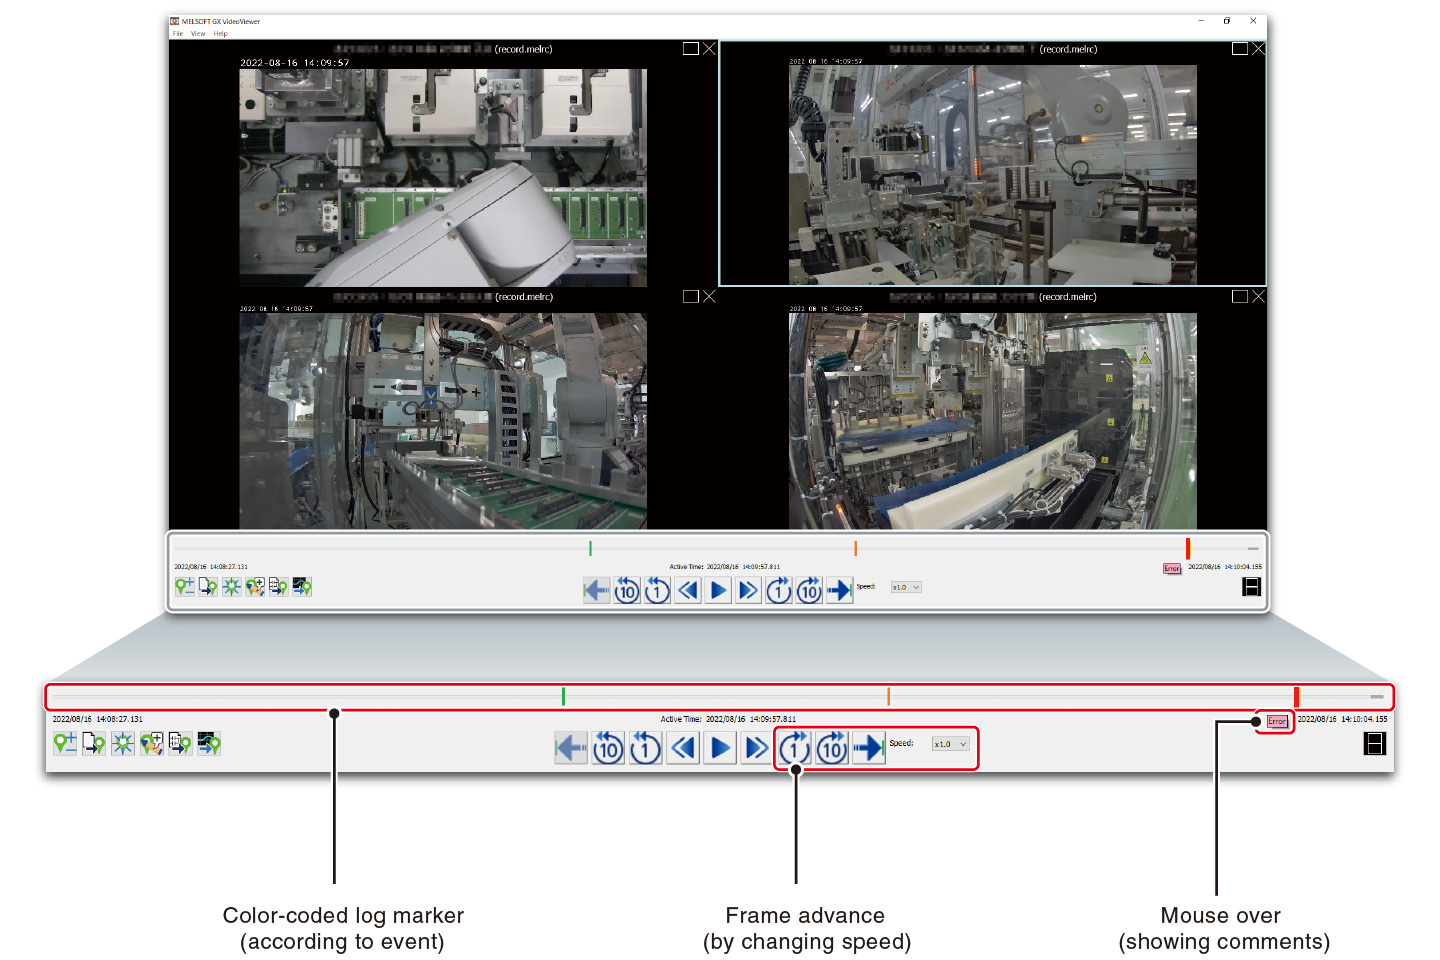
Point14Easily analyze recorded video feeds
-
Analysis is easy by adding milestone points (log marker) to the main video timeline enabling reference points for area of concern and synchronizing these points between GX Works3 (circuit monitor) and GX LogViewer (waveform display)
- ❶Milestone points (log marker) can be added to the moment when an error occurs
Share log markers among concerned personnel - ❷Log markers can be classified for easier identification
Color-coding, commenting
- ❶Milestone points (log marker) can be added to the moment when an error occurs