Satellite Data Solutions
Assessing Damage in Disaster Scenarios
In the event of natural disasters, analyzing the differences between pre- and post-disaster radar (SAR) satellite images allows for the extraction of detailed damage assessments. Below is a notable example.
Noto Peninsula Earthquake, 2024
On January 1, 2024, at approximately 16:10, a magnitude 7.6 earthquake struck the Noto region in Ishikawa Prefecture at a depth of 16 km. This earthquake caused significant damage across Ishikawa and surrounding areas, including building collapses, landslides, and fires. Utilizing publicly available satellite data and aerial photographs, our company estimated the extent of damage, identifying areas affected by fires, liquefaction, structural damage to buildings and roads, and changes to the landscape.
Assessing Damage in Disaster Scenarios
Using ALOS-2 (Advanced Land Observing Satellite-2) data provided by the Japan Aerospace Exploration Agency (JAXA) through the "ALOS series Open and Free Data" initiative (https://www.eorc.jaxa.jp/ALOS/en/dataset/alos_open_and_free_e.htm), we conducted interferometric analysis with images captured on December 6, 2023, and January 3, 2024.
To mitigate the impact of significant ground surface changes caused by the earthquake such as collapsed buildings and altered landscapes we conducted interferometric analysis, allowing us to estimate the crustal deformation.
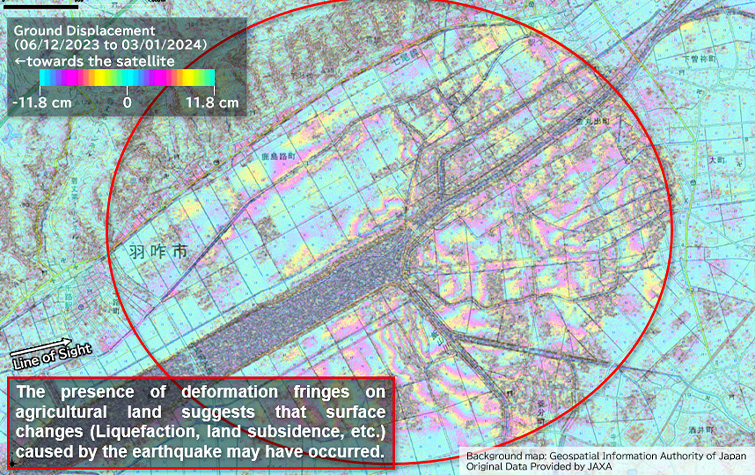 Ground Changes Around Kanamaru De Town, Hakui City, Ishikawa Prefecture
Ground Deformation Monitoring
By applying time-series interferometric analysis techniques to radar (SAR) satellite images, it is possible to detect not only immediate changes during a disaster but also gradual and widespread minor ground deformations over extended periods.
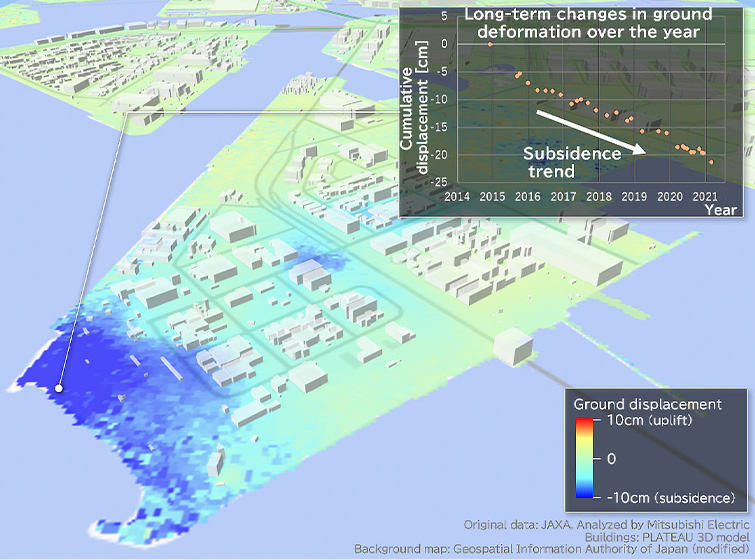
The above example visually represents the estimated ground deformations that occurred from December 2014 to March 2021. This visualization is achieved by overlaying the analysis results from radar (SAR) satellite images with three-dimensional building information.
The light green areas indicate no deformation, while the blue areas show subsidence. The graph illustrates the time-series changes from the end of 2014 to 2021.
Marine Surveillance
Dynamic Monitoring Through Video
Radar (SAR) satellite images are typically synthesized into a single still image from data captured over a certain period (synthetic aperture time). However, by dividing this data into multiple segments, it is possible to generate multiple images from the same acquisition, which can be combined to create a video. This video capability allows for the detection of moving objects and monitoring their movement. Features of radar imaging enable us to monitor dynamic activity regardless of weather conditions or time of day. The video below, created from data captured by the ALOS-2 (Advanced Land Observing Satellite-2) satellite in spotlight mode, illustrates the wave patterns around Iwo Jima.
Quantitative Land Use Change Detection
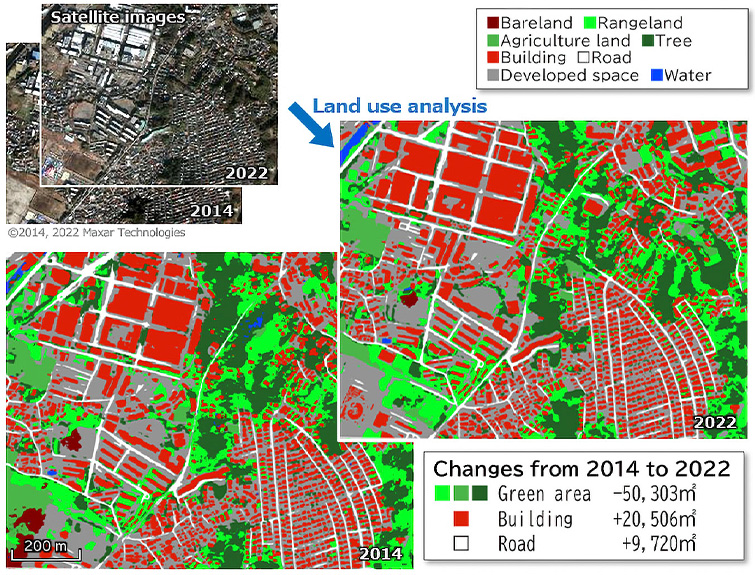
Our AI-driven land use analysis technology* refines models for target satellite images to quantitatively capture wide-area land surface conditions and temporal changes from any satellite image.
* This technology utilizes the research of OpenEarthMap (Xia, J., Yokoya, N., et al., 2023).
The figure below illustrates an example where AI was used to estimate land use for optical satellite images from 2014 and 2022, showing the area and changes in green spaces, buildings, roads, etc.
Data Fusion of IoT Appliances and Satellite Data
While satellite data alone can provide insights into flood inundation during disasters, combining this data with IoT appliance data, news reports, and social media information enhances the accuracy and comprehensiveness of the information.
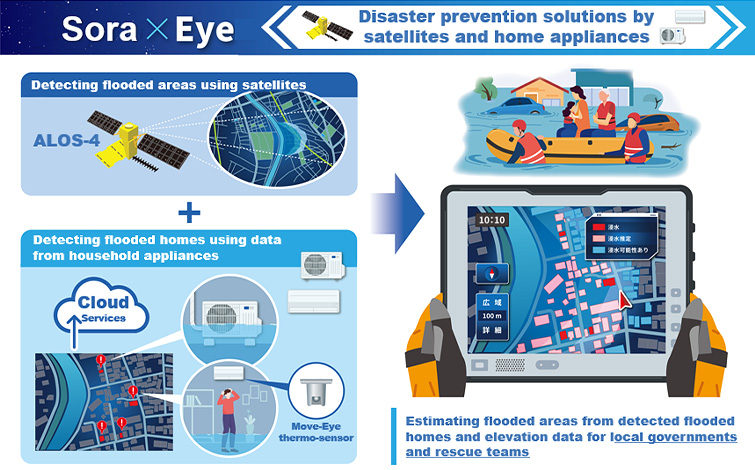
Radar (SAR) satellites offer the advantage of monitoring extensive inundation areas under conditions where aircraft and helicopters face difficulties, such as at night or during adverse weather. However, due to orbital constraints, satellites may not always capture the affected areas at optimal times.
On the other hand, IoT appliance data, though pinpoint and localized, provides information that is closer to the disaster occurrence timing.
At Mitsubishi Electric, we are working on integrating satellite data with IoT appliance data. This integration allows IoT data to fill the gaps in satellite observation times and serves as highly accurate pinpoint information. Consequently, we aim to achieve comprehensive and precise flood inundation monitoring on a wide scale.

Image Super-Resolution for Optical Satellites
Due to the high altitudes at which satellites operate, typically several hundred kilometers above Earth, the resolution of satellite images is generally lower compared to images taken by aircraft or drones. Our super-resolution technology simulates the degradation of satellite image resolution accurately and refines models that predict and generate high-resolution images from low-resolution data. This enhancement allows for detailed observation of ground features beyond the original resolution of the satellite images.
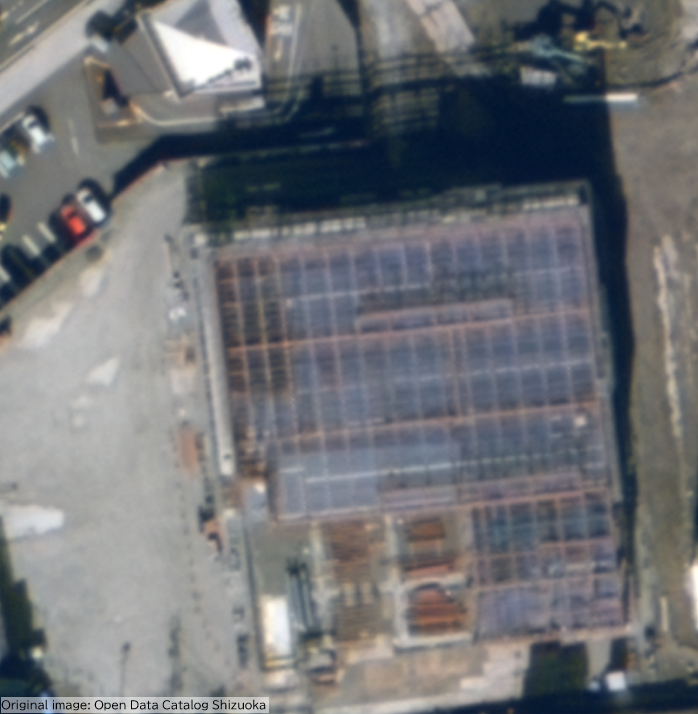
The figure below demonstrates an example where our super-resolution processing improved the resolution of a simulated satellite image from 30 cm to an equivalent of 15 cm. After applying super-resolution, the image shows enhanced clarity, making it easier to discern the details of under-construction buildings and the shapes of vehicles.
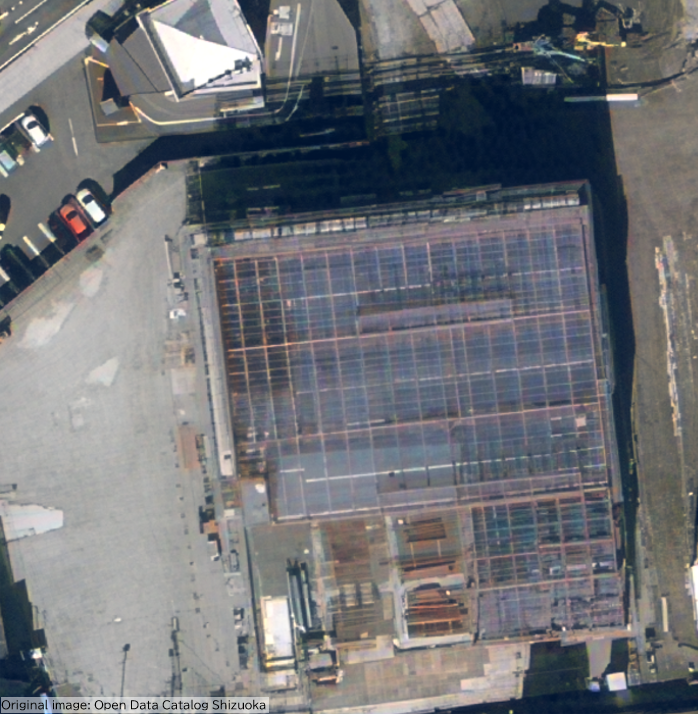
On the left is the original simulated satellite image (30 cm resolution), and on the right is the image after super-resolution processing (equivalent to 15 cm resolution). By dragging the boundary in the image, you can compare the images before and after super-resolution processing.
