e-F@ctory Starter Package Features

Easily enhance facilities, realizing a powerful production site
Highlights
- Programmable controller and GOT (HMI) realizes IoT infrastructure on the shop floor
- Sample projects of control program and screen design data provided
- Easily realize IoT with basic settings such as parameter registration
Features
Utilization of IoT in manufacturing
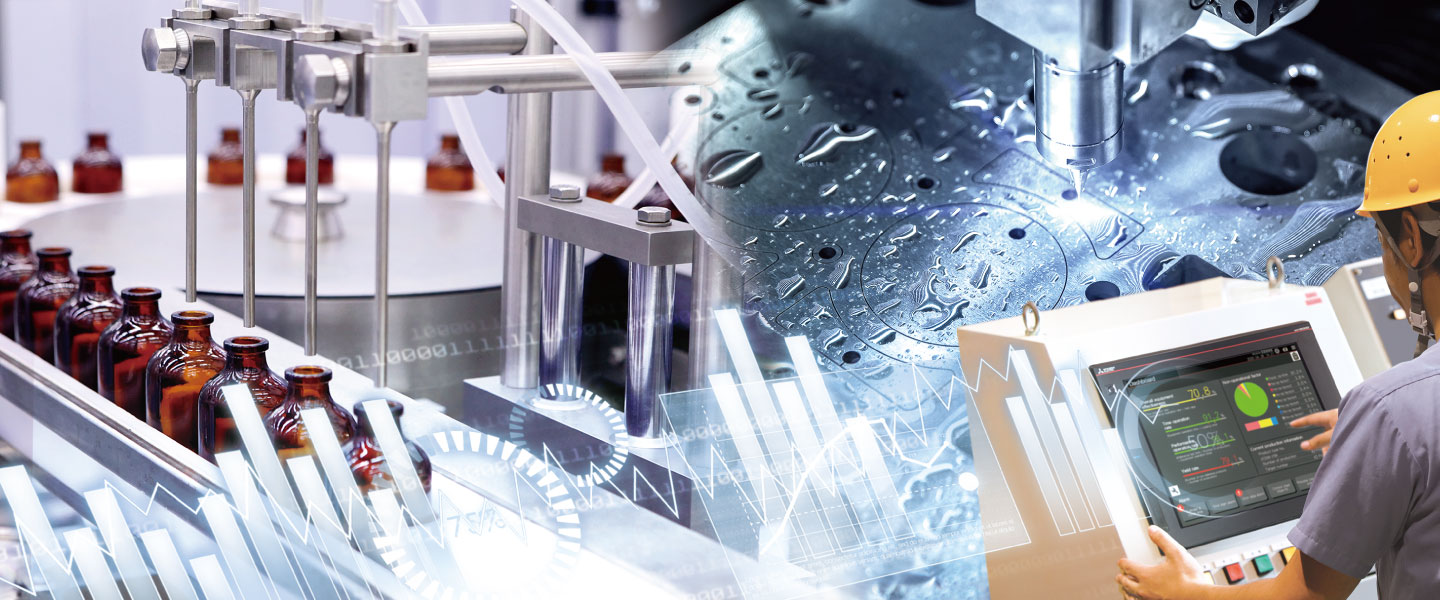
IoT technology adoption in manufacturing enables real-time monitoring of production equipment, manufacturing status, and product quality, making feedback to the equipment and operators easier, thereby realizing continuous cost down of the whole plant. Utilization of data managed through IoT realizes a powerful production site which is highly productive with quick response to failures.
Support IoT on the shop floor
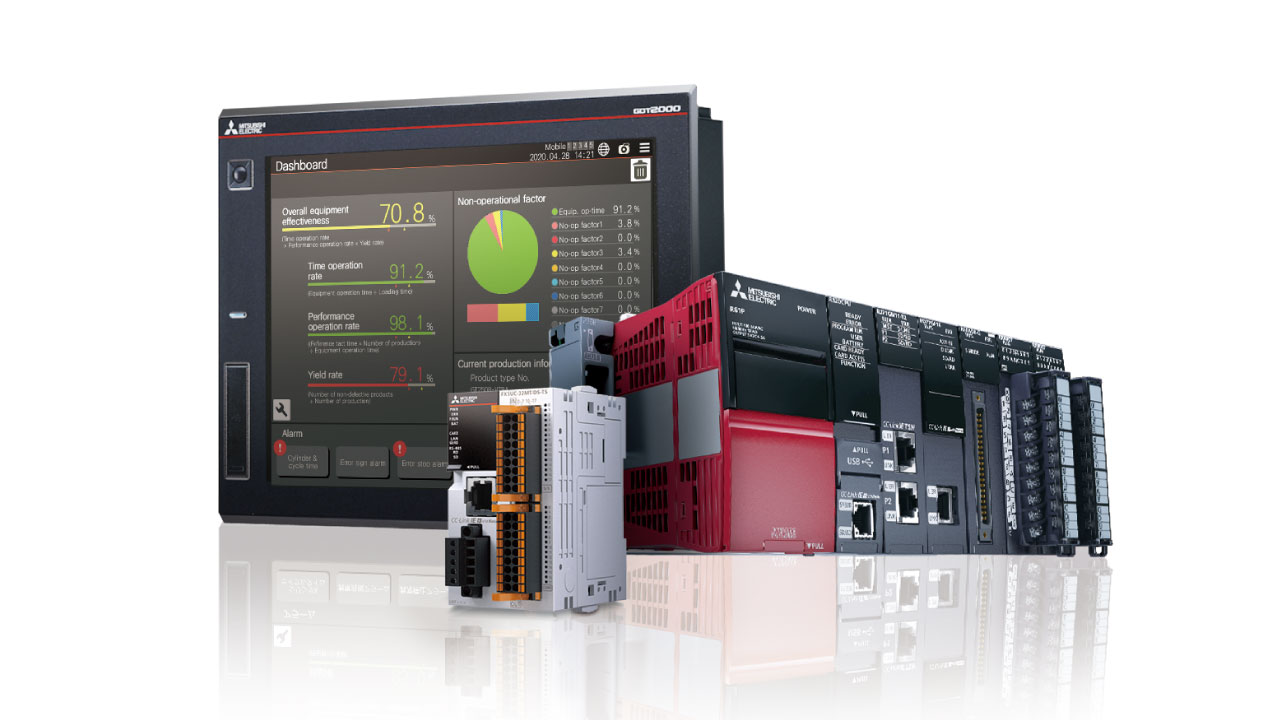
The e-F@ctory starter package includes sample projects for the MELSEC iQ-R/iQ-F Series programmable controller and the GOT2000 Series human-machine interface. Programs for visualization and simple analysis are provided in sample project format, realizing IoT infrastructure on the shop floor just with basic settings such as device assignment and parameter registration. The starter package can help solve issues including consideration time and budget required for IoT system construction.
Various functions are available
Functions to realize IoT such as for “visualization” and “simple analysis” of production data are available as the e-F@ctory starter package. These functions can be utilized according to its application.
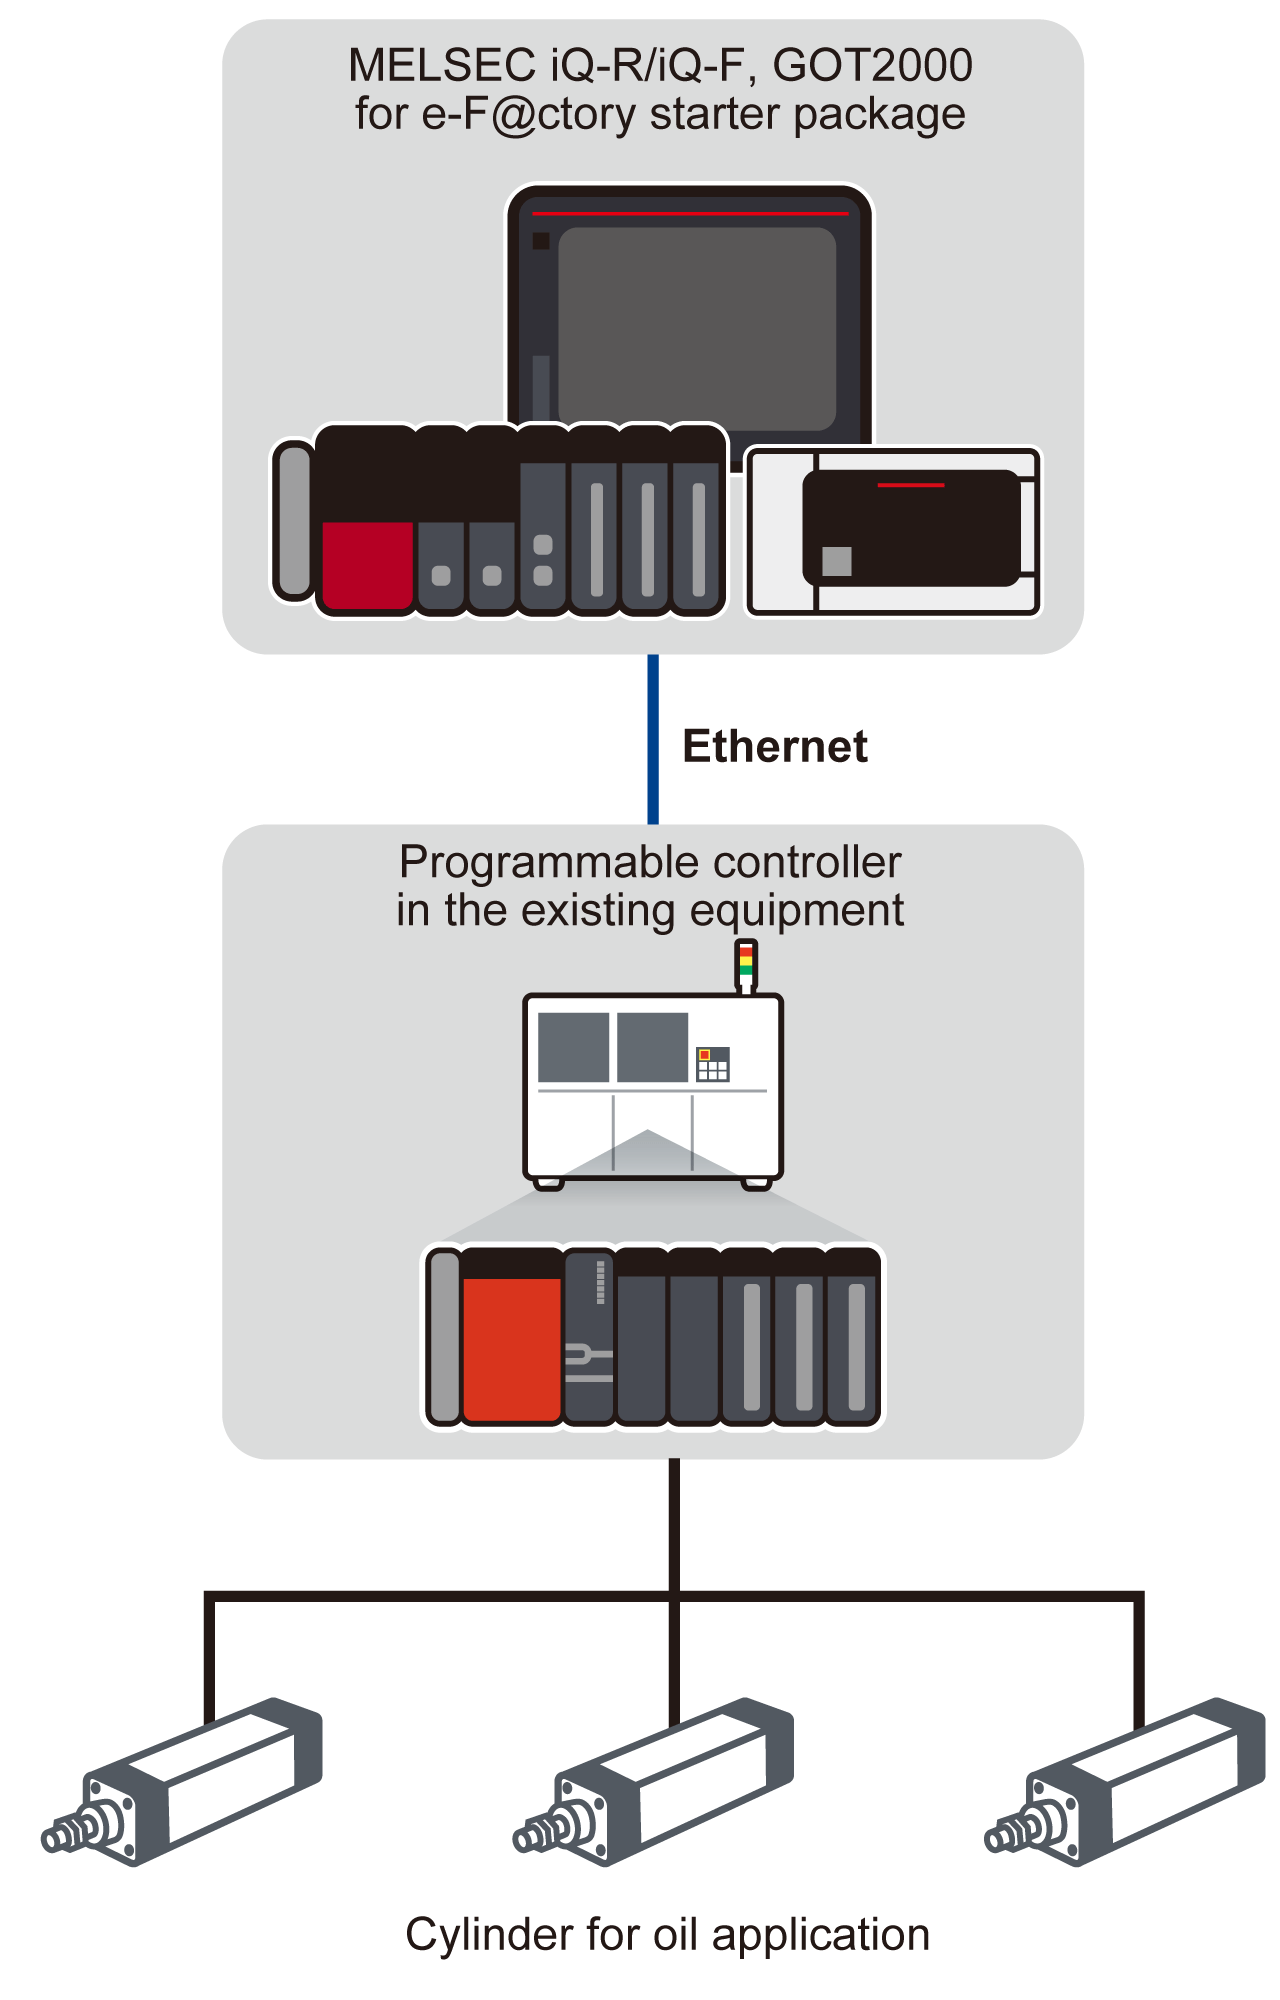
Realize IoT with minimum impact to the existing equipment
Adding a programmable controller and GOT (HMI) embedded with the e-F@ctory starter package can easily realize IoT in manufacturing with minimum impact to the existing equipment.
Functions
The e-F@ctory starter package is a package of sample projects for analyzing equipment information collected in the programmable controller and displaying analyzed results on the GOT (HMI). Designing complex analysis algorithms and graphs is unnecessary, realizing the equipment operation monitoring system at a lower cost.
MELSEC iQ-R Series
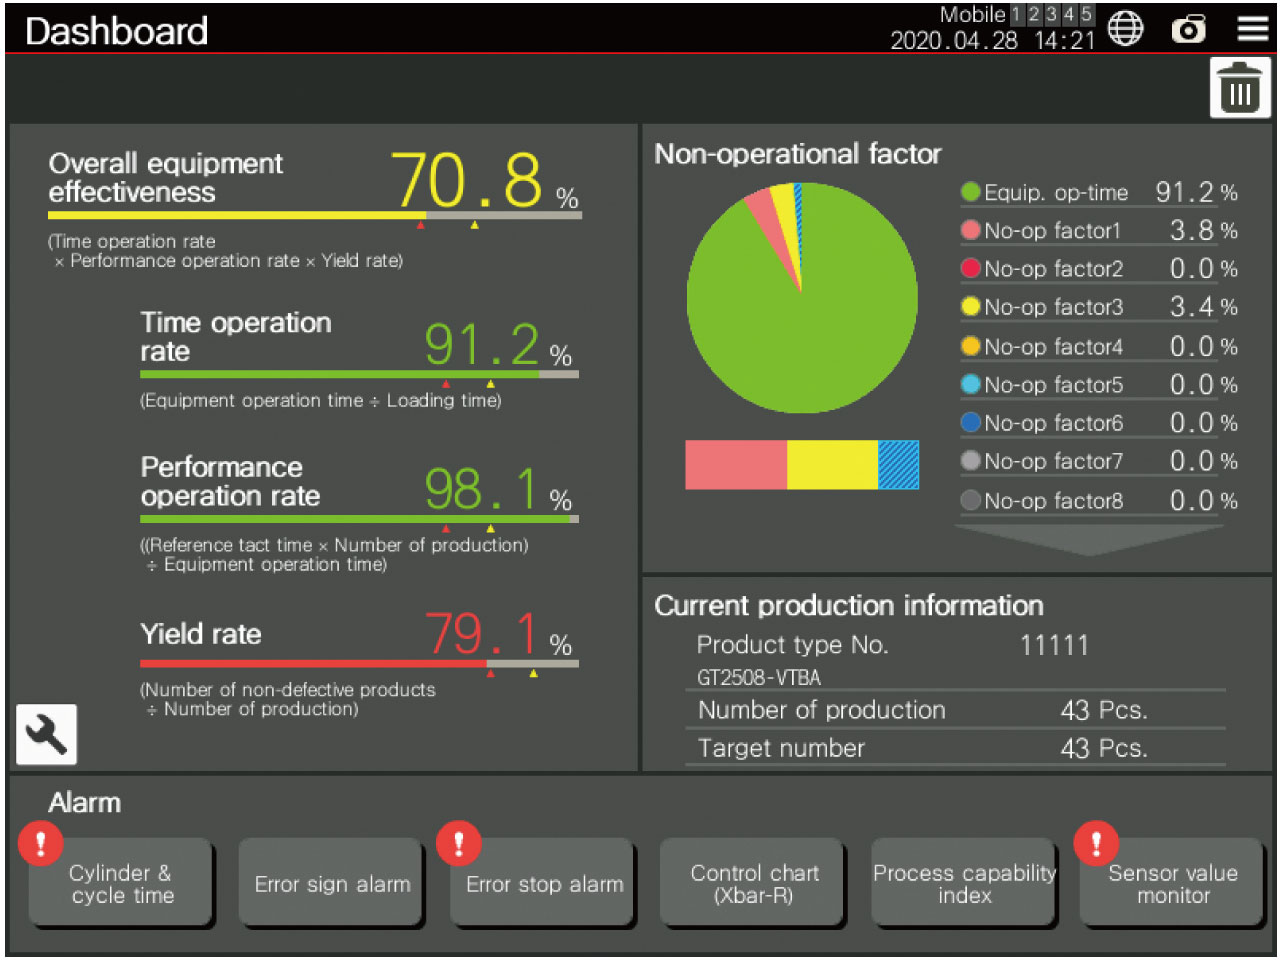
Equipment operation monitor
This is useful for visualization of equipment operational status and simple analysis. Functions include “Dashboard” for visualizing KPI of equipment such as overall equipment effectiveness, “Cylinder and cycle time measurement monitor” for measuring the operating cycle time of the cylinder, and “Process capability index (Histogram)” for calculating process capability index which is quality management criteria of the process and shows inspection data as histogram. Realizes IoT infrastructure of the equipment.
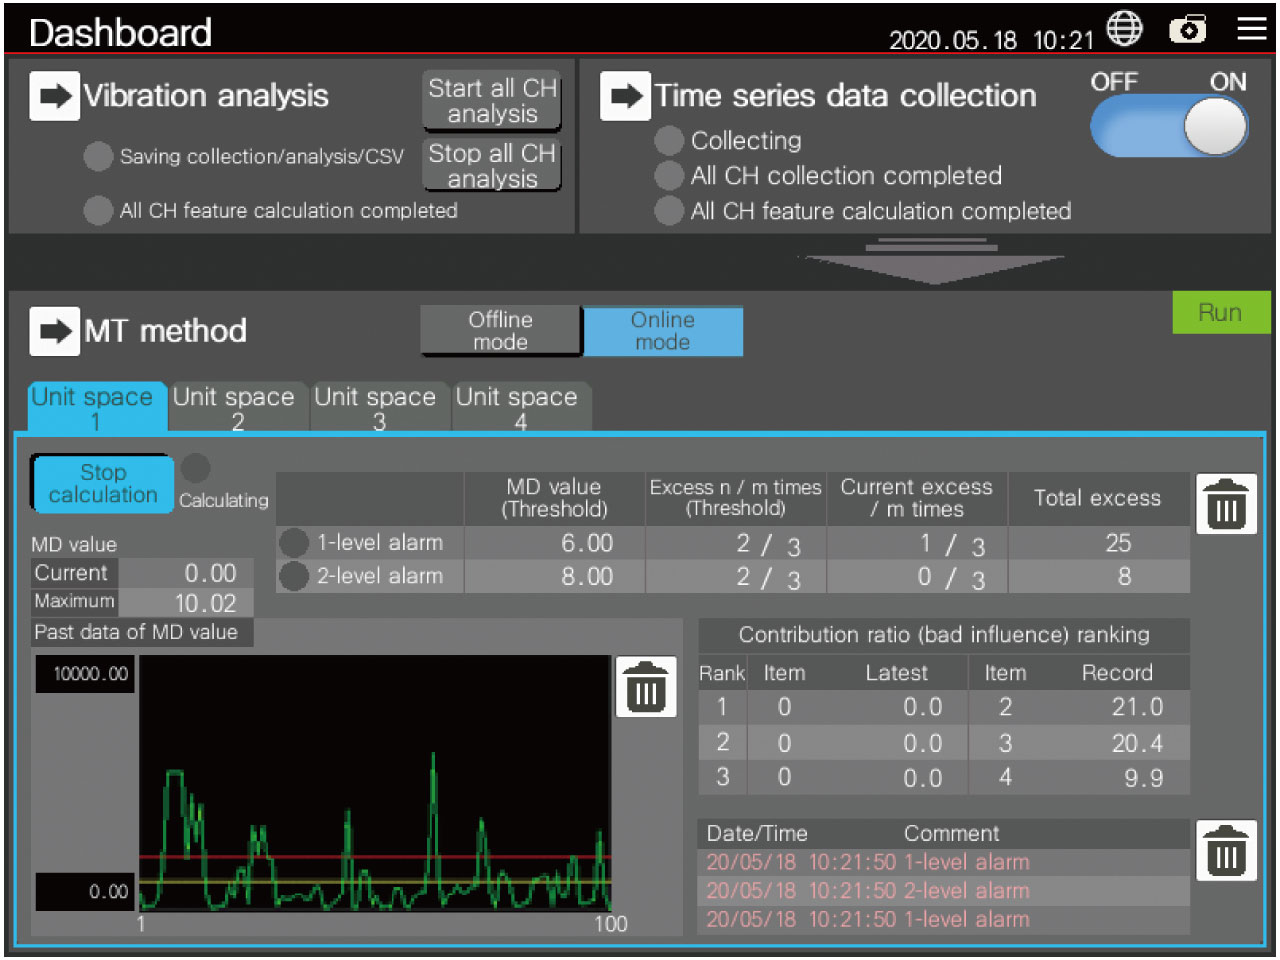
MT method simple diagnosis
MT method is a statistical method to detect “difference from usual”.Feature amount (maximum value, minimum value, average value) of various waveform data such as vibration, current, temperature, and pressure are calculated just by registering parameters, then the calculated results are analyzed by MT method to detect “difference from usual”. Unusual condition of equipment, machines and products can be detected, realizing predictive maintenance and quality check.
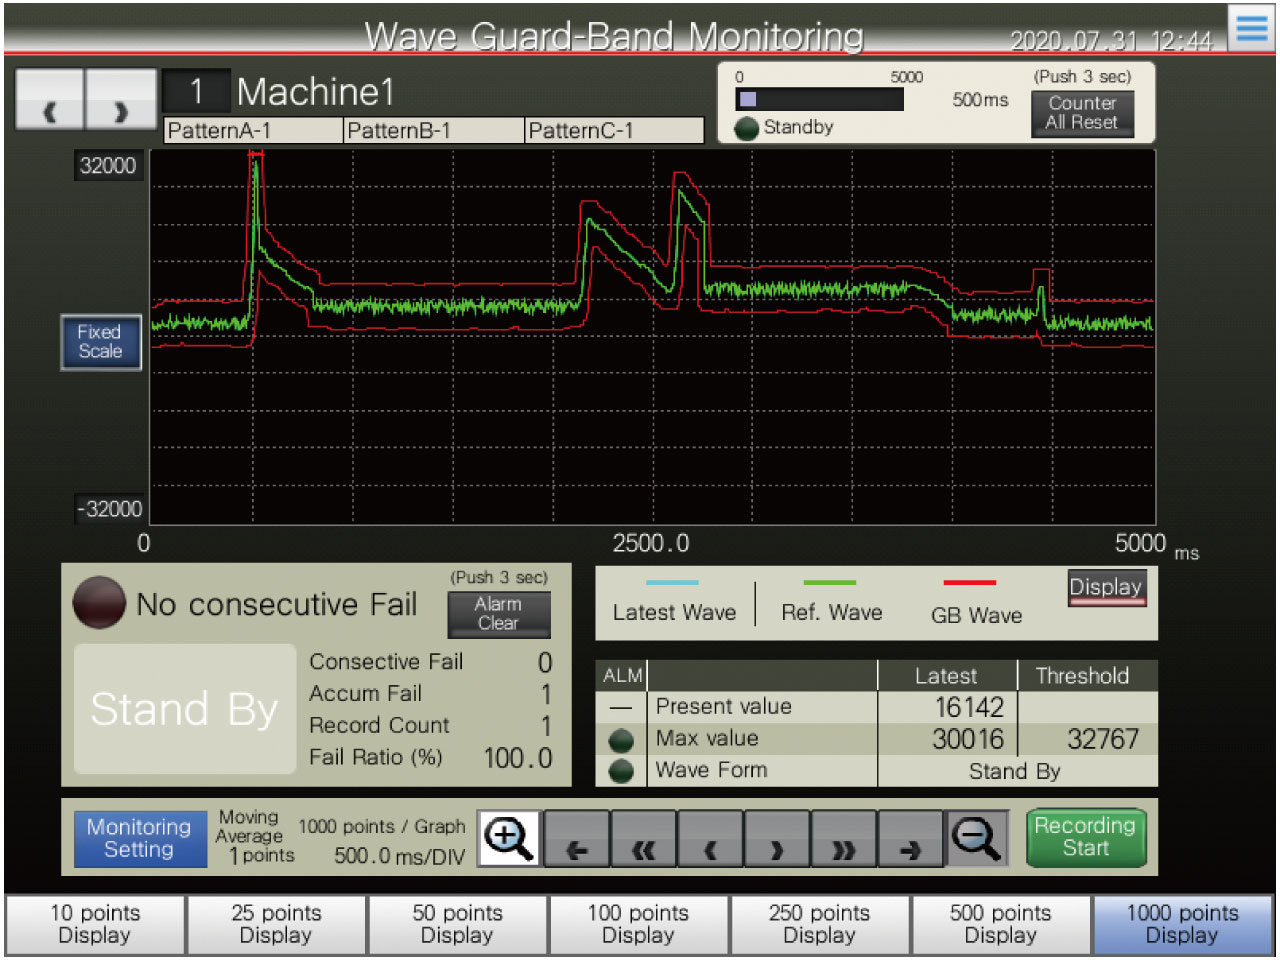
Wave guard band monitoring
Monitors threshold according to waveform shape. Guard band monitoring allows monitoring of waveform shape of analog waveform data such as current and temperature. Abnormal waveform variation can be detected by waveform monitoring which was difficult with simple threshold monitoring.
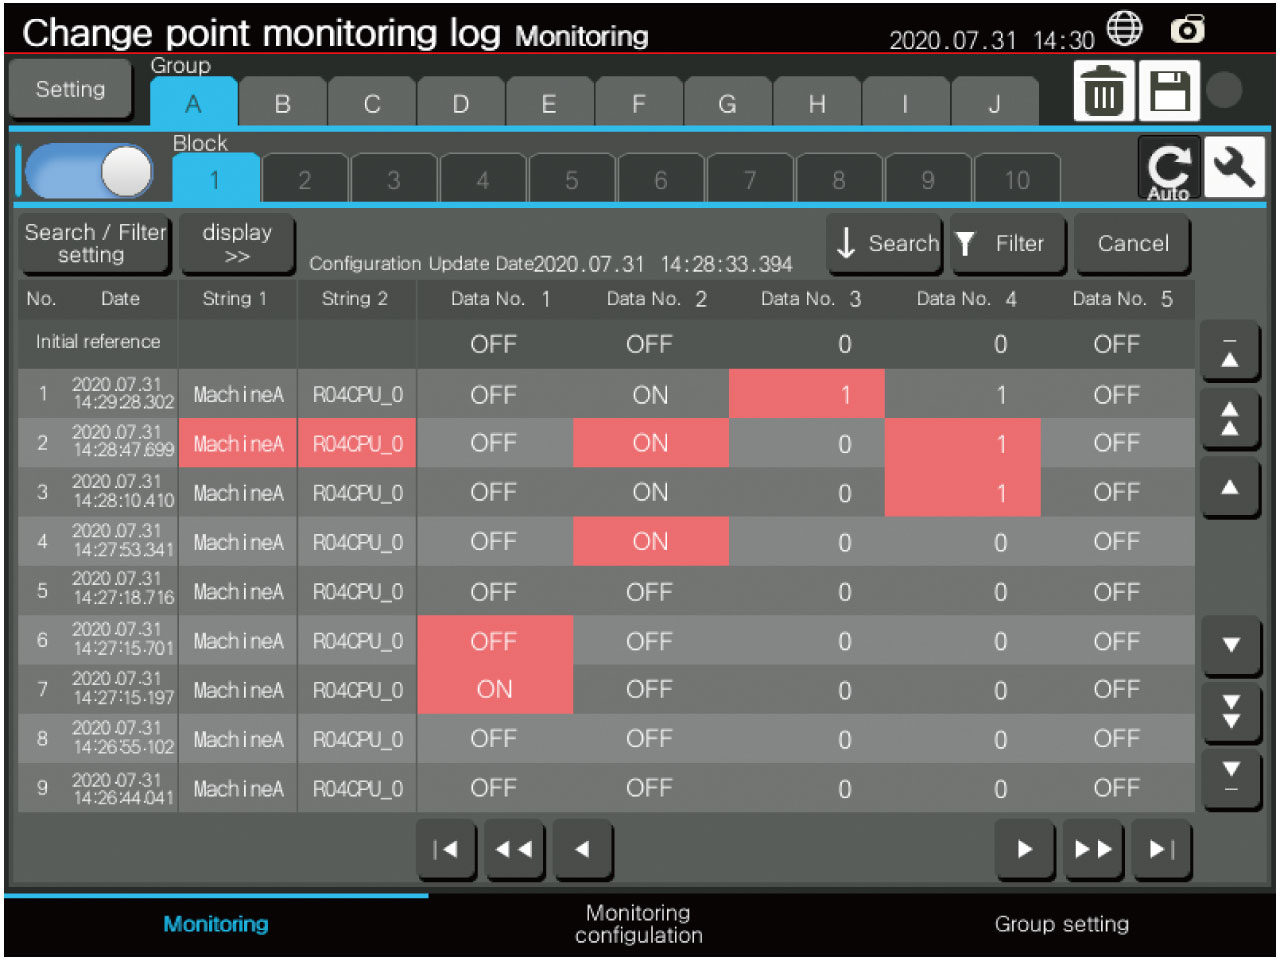
Change point monitoring log
Function to detect and save change point of equipment and process used for manufacturing improvement. From the perspective of 5M*1, record various monitored data with time stamp by monitoring timing where any changes in operation, various parameter settings, and measured values were made. This function is useful for investigating an error cause of equipment and inferior quality.
*1.5 M stands for Man, Machine, Material, Method, and Measurement.
MELSEC iQ-F Series
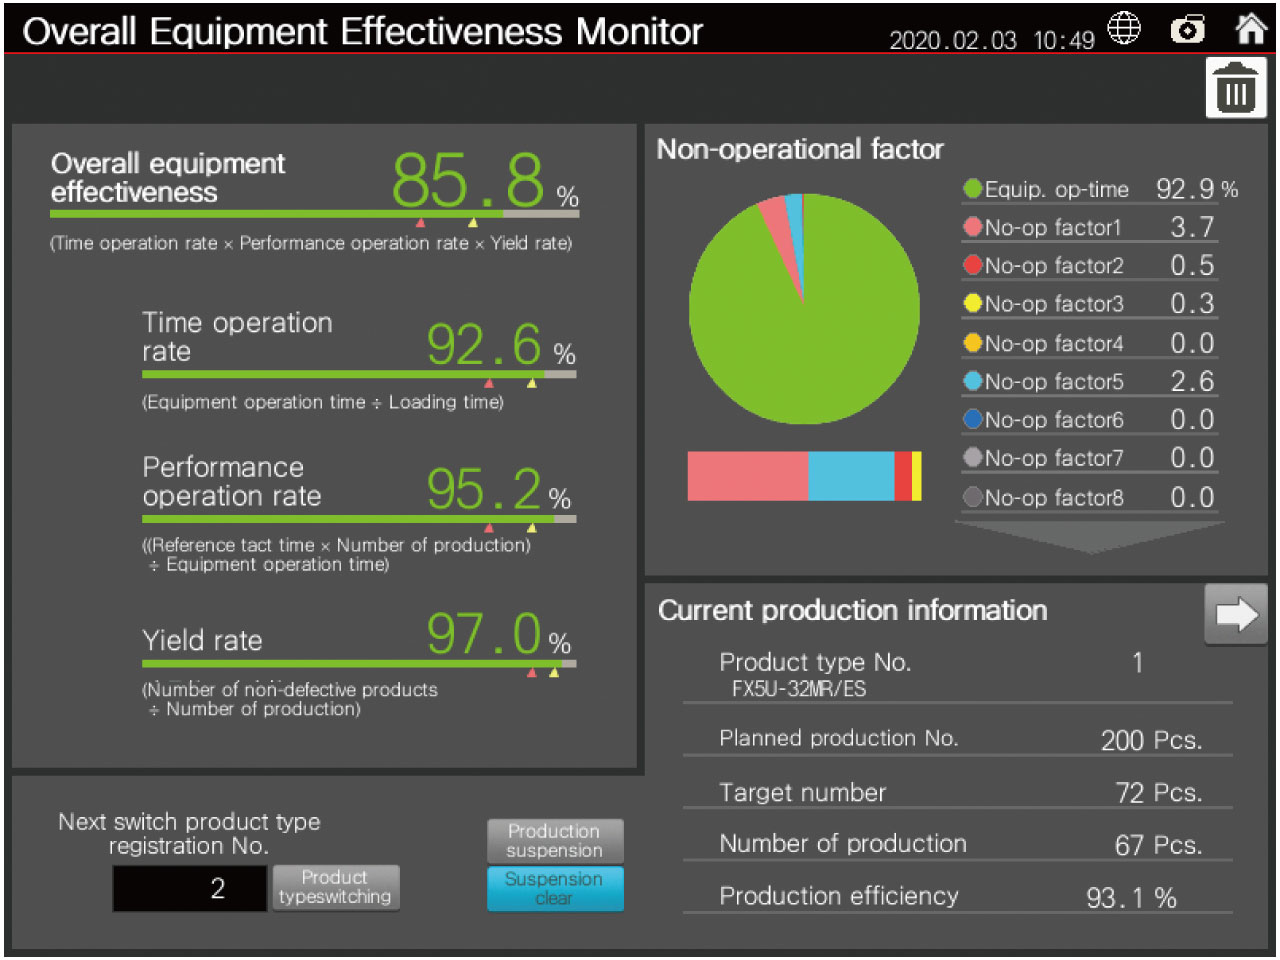
Overall equipment effectiveness monitor
Function for visualizing equipment KPI such as overall equipment effectiveness. Displays overall equipment effectiveness, time operation rate, performance operation rate, yield rate, total operation/non-operation rate and current production information so that operation status of equipment can be monitored on the GOT (HMI) at once.
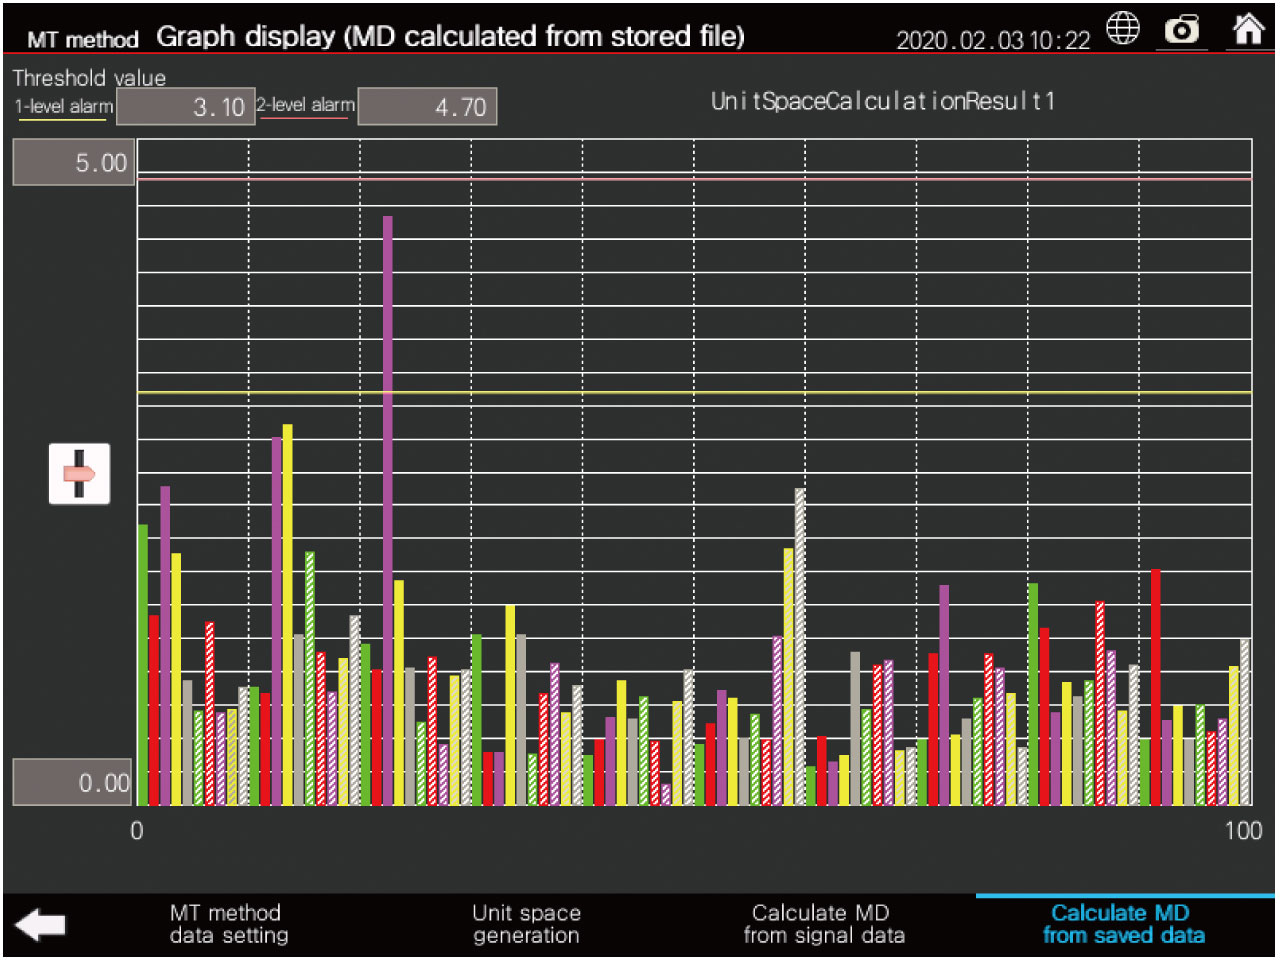
MT method
MT method is a statistical method to detect “difference from usual”.
By utilizing MT method, unusual condition is detected based on feature amount (max. value, min.value, average value) of data calculated by customer’s program. Unusual condition of equipment, machines and products can be detected, realizing predictive maintenance and quality check.
Application
Operation of air cylinder in the process of oil application to an iron plate becomes slower with dirts and scratches, leading to lowered operation efficiency. Maintenance was carried out when an operator noticed operation delay. However, operation delay is usually too slight to notice.
The e-F@ctory starter package cylinder and cycle time measurement monitor*2 can visualize operation time, realizing automatic detection of operation delay. Maintenance at an appropriate timing is possible, which can prevent decline in manufacturing efficiency.
*2.Function to monitor devices such as cylinder which operate at a determined time (master time). Determine an upper limit and a lower limit value based on master time, and output an alarm when the operation time does not fall within the range.
Product List
MELSEC iQ-R Series
| Function name | Outline |
|---|---|
| Wave guard band monitoring | Guard band monitoring of analog input waveform |
| Vibration analysis*3 | Monitors OA (overall value) by analyzing vibration waveforms using frequency analysis (FFT) |
| Change point monitoring log | Changes point management from perspectives of 4M*4and 5M +1E*5 |
| Output as spreadsheet | Operation function of equipment operation monitoring. Spreadsheet (log) function*6embedded with equipment operation monitor is output as Excel® file format |
| Equipment operation monitor | |
| Dashboard | Comprehensively displays the production and operational status of the equipment such as overall equipment efficiency and number of production |
| Production counting | Displays the production status by product type and time zone by setting product type and time zone |
| Process capability index (histogram) | Displays the data collected from the equipment in a histogram and calculates the process capability index |
| Operational status monitor | Displays the equipment operational status of a day in a graph |
| Specific energy consumption management | Calculates specific energy consumption from energy amount and production volume to grasp wasteful energy of equipment and such |
| Cylinder and cycle time measurement monitor | Measures the operating status of the cylinder and the equipment operation cycle and monitors the error sign |
| Error sign inspection | Monitors error sign signals, and displays corrective actions registered in advance when an error sign appears |
| Error stop action | Monitors error stop signals, and displays corrective actions registered in advance when an error stop occurs |
| Sensor value monitor | Monitors the sensor value does not exceed the set threshold |
| Equipment trouble Pareto chart | Displays the status of an error stop alarm due to the operation rate drop in a Pareto chart |
| Control chart (Xbar-R) | Displays the data collected from the equipment as the X-R control chart in real time |
| Loss time analysis | Measures the equipment non-operation time for each factor and displays the rate by total/time zone/date |
| MT method simple diagnosis | |
| MT method | Quantifies the deviation degree between the normal data and input data to detect an error. Inputs feature quantities calculated by time series data collection and vibration analysis as input data |
| Time series data collection | Calculates feature quantities from time series data such as temperature and current |
| Vibration analysis*3 | Calculates feature quantities by analyzing vibration waveforms using frequency analysis (FFT) |
- *3.Same function.
- *4.Man, Machine, Material, Method
- *5.Man, Machine, Material, Method, Measurement, Environment
- *6.Dashboard, production volume counting, process capability index (histogram), equipment trouble Pareto chart, loss time analysis
MELSEC iQ-F Series
| Function name | Outline |
|---|---|
| Overall equipment effectiveness monitor | Displays manufacturing and operating status such as overall equipment effectiveness and production volume |
| Cylinder and cycle time measurement monitor | Measures and monitors cylinder status and operation and operating cycle of equipment to monitor any fault developing |
| MT method | Quantifies the deviation degree between the normal data and input data to detect an error |
Compatible device
MELSEC iQ-R Series
| Function name | Programmable controller MELSEC iQ-R*7 | GOT (HMI) GOT2000 Series*7 |
|---|---|---|
| Wave guard band monitoring | R08CPU | Module with resolution SVGA (800×600) |
| Vibration analysis | R16CPU、NZ2MC-4MBS、R60ADH4 | Module with resolution SVGA (800×600) |
| Change point monitoring log | R04CPU、NZ1MEM-2GBSD | Module with resolution SVGA (800×600) |
| Equipment operation monitor | R16CPU | Module with resolution SVGA (800×600) |
| MT method simple diagnosis | R16CPU、NZ2MC-16MBS、RD55UP06-V、R60ADH4、NZ1MEM-2GBSD*8 | Module with resolution SVGA (800×600) |
MELSEC iQ-F Series
| Function name | Programmable controller MELSEC iQ-F*7 | GOT (HMI) GOT2000 Series*7 |
|---|---|---|
| Equipment overall efficiency monitor | FX5U/FX5UC CPU module | Module with resolution SVGA (800×600) |
| Cylinder and cycle time measurement monitor | FX5U/FX5UC CPU module | Module with resolution SVGA (800×600) |
| MT method | FX5U/FX5UC CPU module | Module with resolution SVGA (800×600) |
- *7.For more information, please consult your local Mitsubishi Electric representative.
- *8.An SD memory card for inserting to the RD55UP06-V.