Energy Saving Supporting DevicesEnergy Saving Data Collecting Servers


Helps to manage and reduce CO₂ emissions
to achieve carbon neutrality!
Case Studies
Feature
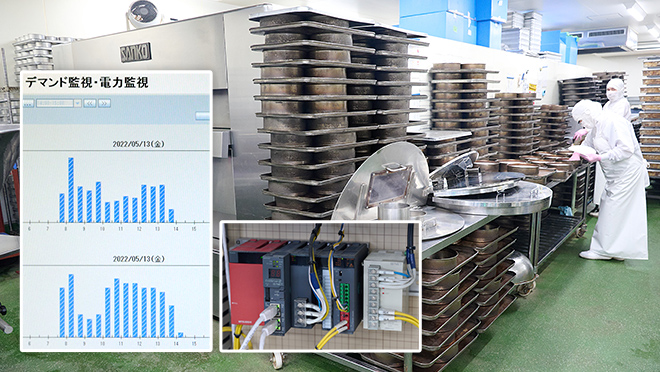
Graphs of measurement data in a web browser

Visualizing your data
The web server capability allows you to check energy usage in real time from PCs in the same network.

Compatible with smartphones and tablets
Graphs can be viewed from mobile devices such as smartphones and tablets as well as PCs.

No need to create graphics
A wide variety of built-in graphing functions allow for energy-saving management that matches your needs.
Data utilization and remote notification with automatic data transfer and email notification functions

Easy data utilization
Measurement data can be automatically transferred to an FTP server. This allows you to utilize data in host systems and backup measurement data.

Acceleration of PDCA cycles
EcoWebServerIII sends email to notify you when targets are exceeded or equipment operating status changes. This allows for early remote detection of abnormalities.
Centralized demand monitoring and energy data management

Operations and management
Monitoring power demand and local energy consumption identifies why peaks occur. This helps save energy and efficiently suppress demand.

Automatic control
EcoWebServerIII issues alerts when target demand is likely to be exceeded. It also automatically stops the load of air conditioning, lighting, and other devices to suppress demand.

System links
Demand suppression can be achieved by linking EcoWebServerIII with the Mitsubishi Electric air-conditioning controller AE-200J and other devices.
Expansion of systems and applications with connections to PLCs and graphic operation terminals (GOTs)

Improved productivity
Collecting production information held by PLCs allows you to manage intensity alongside energy information and to carry out equipment-specific improvement activities.

Increased awareness of energy conservation on site
Collected data can be displayed in GOT. This allows for real-time on-site monitoring, including intensity and demand.

